Build
The canvas
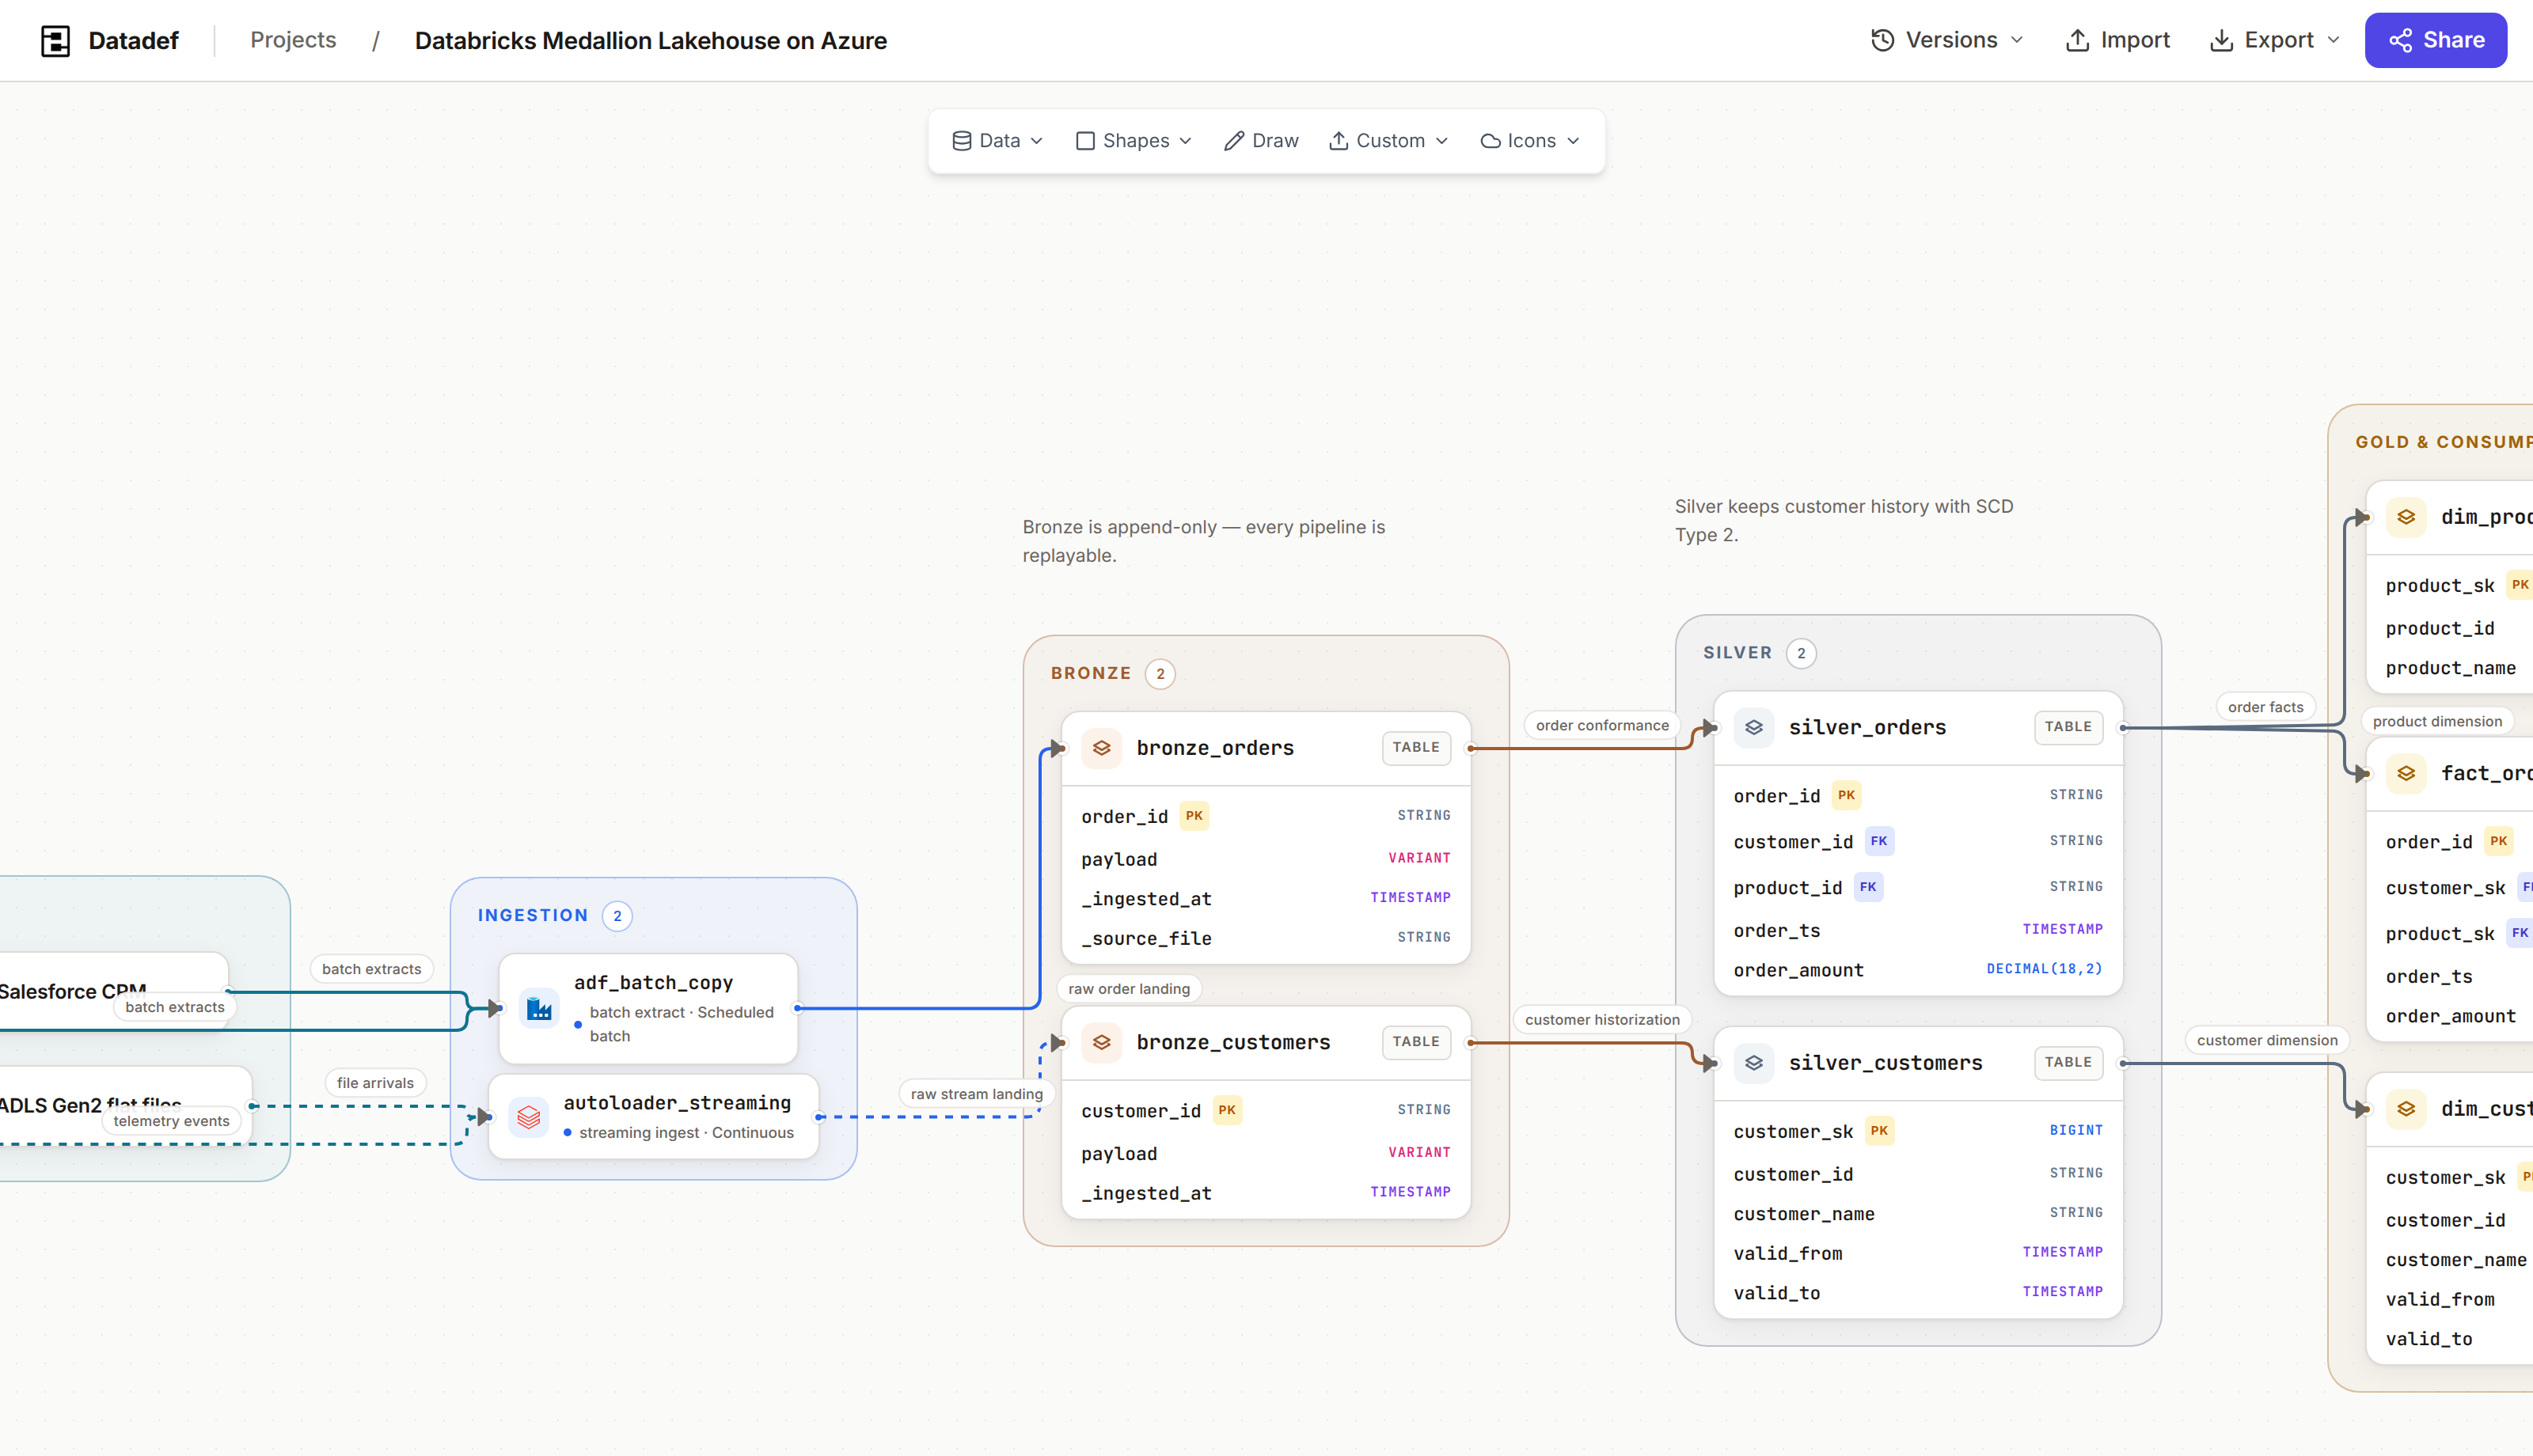
A diagram you cannot edit is a dead end, and a drawing tool that knows nothing about data makes you fake the details. Every Datadef diagram is a canvas document you edit directly: nodes are typed, edges mean flow, zones group and nest, and column-level lineage is its own layer. The same document is what generation writes, what collaborators see, and what embeds render, so a change lands everywhere at once.
How it works
- 1Start from a generated diagram, a template, or a blank canvas, and add nodes from the toolbar.
- 2Select any node or edge to edit it in the properties panel: name, columns, colors, icon, and metadata.
- 3Connect columns to columns in the Lineage tab; the relationships render in their own layer, so the flow picture stays readable.
- 4Publish a version when the diagram reaches a state worth keeping; restore it later if an edit goes wrong.
What lives on the canvas
Typed nodes
Nodes carry a type, and the type changes what the node can hold: data sources, pipelines, tables with columns, KPIs, and consumption endpoints such as dashboards or applications. Table columns are real fields, not text: they are what lineage connects to.
Edges
Edges mean data flow. Column-level lineage is deliberately separate from edges: a lineage relationship links one column to another and renders in the lineage layer, so the flow picture stays readable while the detail stays available.
Zones
Zones group nodes and nest: a platform zone can hold layer zones which hold the nodes. Annotations sit alongside: text notes, shapes, and flow arrows for the narrative a reader needs.
The properties panel
Selecting a node or edge opens the right-hand panel. The Properties tab edits the selection: name, columns, colors, icon, and metadata, with duplicate and delete at the bottom. The Lineage tab shows and edits the column-level relationships of data-carrying nodes (tables, sources, pipelines, KPIs, consumption). The Canvas tab needs no selection: it holds the diagram-level options, and for repo-linked projects the repository link, sync controls, and the generated architecture doc.
On shared projects, the panel respects your role: viewers see values, editors change them. Roles are covered in Sharing and permissions.
Mouse and keyboard
| Input | Action |
|---|---|
Drag on empty space | Pan the canvas |
Scroll wheel | Zoom |
Cmd/Ctrl + Click | Multi-select |
Cmd/Ctrl + Z | Undo |
Cmd/Ctrl + Y | Redo |
Cmd/Ctrl + A | Select all nodes |
Cmd/Ctrl + D | Duplicate selection |
Delete / Backspace | Delete selection |
Escape | Deselect |
Versions
Every project has one working canvas, which is what you and your collaborators edit. From the versions menu you can publish the current working state as a numbered version with a name and description. Published versions are snapshots: they do not change when the working canvas does, and any of them can be restored back to working when an edit went wrong or you need the state you presented last quarter.
Templates
The template gallery holds working diagrams you can start from instead of prompting. You can also publish your own project as a template. Two things to know before publishing:
- Published templates are public and carry your name.
- A template captures the diagram at publish time. Editing the source project does not update the template; republish to update it.