The short answer
Data quality best practice is a short list, not a programme. Run six check types, freshness, row volume, schema drift, nulls on required columns, primary key uniqueness, and accepted values or ranges, at three points in the pipeline: on ingestion so a broken source fails fast, after transformation so logic errors are caught before they land, and on the serving table so what the dashboard reads is what was verified. Those checks cover the six quality dimensions: completeness, accuracy, consistency, timeliness, validity, uniqueness. Cadence follows cost: blocking checks run on every pipeline execution, reconciliation against source systems runs daily, trend and distribution checks weekly, and threshold tuning is a monthly review. Tier the alerts, page for wrong numbers in production, Slack for degraded, digest for informational, because a channel where every alert is a warning gets muted within a month. Start on the five tables behind the dashboards leadership opens, not on all five hundred. dbt tests, Great Expectations and Soda run the checks you declare; Monte Carlo, Bigeye and Elementary add anomaly detection for the failures nobody wrote a rule for. The tool matters less than one owner and one documented action per check.
1. What Are the Best Practices Data Engineers Use to Manage Data Quality?
Eight practices, in the order that pays off. The first four can be in place this week; the last four are what separate a test suite people trust from one they mute. Every data team has the same horror story: a dashboard showed revenue up 40%, the CEO announced it in an all-hands, and then someone noticed a duplicate join. Data quality is not about perfection, it is about catching issues before they reach decision-makers.
Test at the boundaries
Validate data at ingestion (source issues) and at delivery (transformation issues). Catch problems early, and make an upstream break attributable to the team that caused it.
Start with high-value tables
Focus on tables that feed executive dashboards and critical reports first. Prove value, then expand. Four checks on five tables beats four hundred tests nobody reads.
Use both rules and anomaly detection
Rules catch known issues (nulls, duplicates). Anomaly detection catches unknown issues (sudden volume changes, a distribution that shifted overnight).
Tier your alerts
Not every failure deserves a page. P1 for revenue impact, P2 for degraded quality, P3 for informational. Tiering is what keeps the channel readable.
Include runbooks in alerts
Every alert should link to a doc explaining: what it means, how to investigate, how to fix common causes. An alert without a runbook is a notification.
Track quality metrics over time
Measure test pass rate, mean time to detection, mean time to resolution. Write every check result to a table so you can answer whether quality improved, not just whether it is green now.
Make quality part of CI/CD
Run tests on every pull request against a sample. Block merges that break data quality. A model that fails in CI never reaches the warehouse.
Review and tune monthly
Alert thresholds drift. Data patterns change. Schedule a monthly review of which alerts fired, which were true, and which tests have never fired in a year.
The Cost of Bad Data
Gartner puts the average annual cost of poor data quality at $12.9 million per organization. Read that as an order of magnitude, not a measurement: it is an average over self-reported estimates, and it says nothing about your systems. The cost you can actually count is trust. Once stakeholders stop believing a number, they stop opening the dashboard and start deciding from memory.
What the practice buys you
Trust
Stakeholders use data confidently because they know it has been validated. No more "let me double-check that number."
Speed
Catch issues at the source instead of debugging dashboards. Minutes to fix versus hours of investigation.
Scale
Automated checks scale with your data. Manual spot-checks do not work when you have 500 tables.
From experience
The teams I have seen succeed treat data quality like unit tests in software: you do not ship code without tests, and you do not ship data without checks. It is not overhead, it is insurance.
Pro Tip
The "Would I Bet On It?" Test
Before publishing a metric, ask whether you would bet a month of on-call that the number is correct. If the answer is no, you need more checks on the tables behind it. Data quality is about confidence, and confidence comes from validation.
2. The Six Dimensions of Data Quality (and the Test for Each)
The dimensions are the vocabulary, not the work. Their value is that each one maps to an assertion you can write in SQL tonight, so "improve data quality" becomes six specific tests rather than a quarterly objective.
Completeness
Is all required data present?
Test: Null rate on required fields should be 0%
Accuracy
Do values reflect reality?
Test: Cross-reference with source systems
Consistency
Same format everywhere?
Test: Date formats, enum values, naming conventions
Timeliness
Is data fresh enough?
Test: max(updated_at) within SLA window
Validity
Conforms to business rules?
Test: Status in ('active', 'inactive'), price > 0
Uniqueness
No unwanted duplicates?
Test: Primary key is unique, no duplicate orders
| Dimension | Question It Answers | Common Failure Mode |
|---|---|---|
| Completeness | Is it all there? | Nulls in required fields |
| Accuracy | Is it correct? | Stale cache, wrong joins |
| Consistency | Is it the same everywhere? | Different date formats |
| Timeliness | Is it fresh enough? | Pipeline delays, SLA breaches |
| Validity | Does it make sense? | Negative prices, future dates |
| Uniqueness | Are there duplicates? | Duplicate IDs from fan-out joins |
3. Types of Data Quality Checks, With Examples
Six check types catch the overwhelming majority of production incidents. They are high-value and low-effort: each is one assertion against one table. If you want the argument for why these six and not four hundred, the companion guide on data quality checks that matter makes it in detail.
Row count bounds
Check that row count is within expected range (e.g., 900K-1.1M) for the same weekday. Catches truncated loads, duplicate explosions, and a source that silently started filtering.
expect_table_row_count_to_be_between(min=900000, max=1100000)Null rate thresholds
Required fields should have 0% nulls. Optional fields should have stable null rates (alert if rate changes by >10%). Restrict this to columns that are actually required, or the noise problem starts here.
expect_column_values_to_not_be_null(column="customer_id")Unique constraints
Primary keys must be unique. This catches the dreaded fan-out join that multiplies your metrics, and it is the failure that produces wrong numbers rather than missing ones.
expect_column_values_to_be_unique(column="order_id")Freshness SLA
Data should be no older than your SLA allows. Check max(updated_at) or partition date. Highest-yield check of the six: a pipeline that did not run passes every other test on yesterday data.
expect_column_max_to_be_between(column="updated_at", min=now()-24h)Value ranges
Numeric fields should be within valid bounds. Revenue > 0, age between 0-150, percentage 0-100. Catches an amount that went negative and a date that landed in 1970.
expect_column_values_to_be_between(column="price", min=0, max=100000)Enum validation
Status fields should only contain expected values. Catches typos and unexpected states from upstream, which is the check most often missing when a semantic change slips through.
expect_column_values_to_be_in_set(column="status", value_set=["active", "inactive", "pending"])Two more are worth adding once those six are running: schema drift, which flags a column added, removed or retyped upstream, and referential integrity, which catches orphaned foreign keys after a join. The same six express naturally in dbt as schema tests.
Example: dbt schema test
# models/marts/orders.yml
version: 2
models:
  - name: orders_mart
    description: "Order-level facts for analytics"
    columns:
      - name: order_id
        tests:
          - unique
          - not_null
      - name: customer_id
        tests:
          - not_null
          - relationships:
              to: ref('dim_customers')
              field: customer_id
      - name: order_total
        tests:
          - not_null
          - dbt_utils.accepted_range:
              min_value: 0
              max_value: 1000000
4. Where Do Data Quality Checks Belong in the Pipeline?
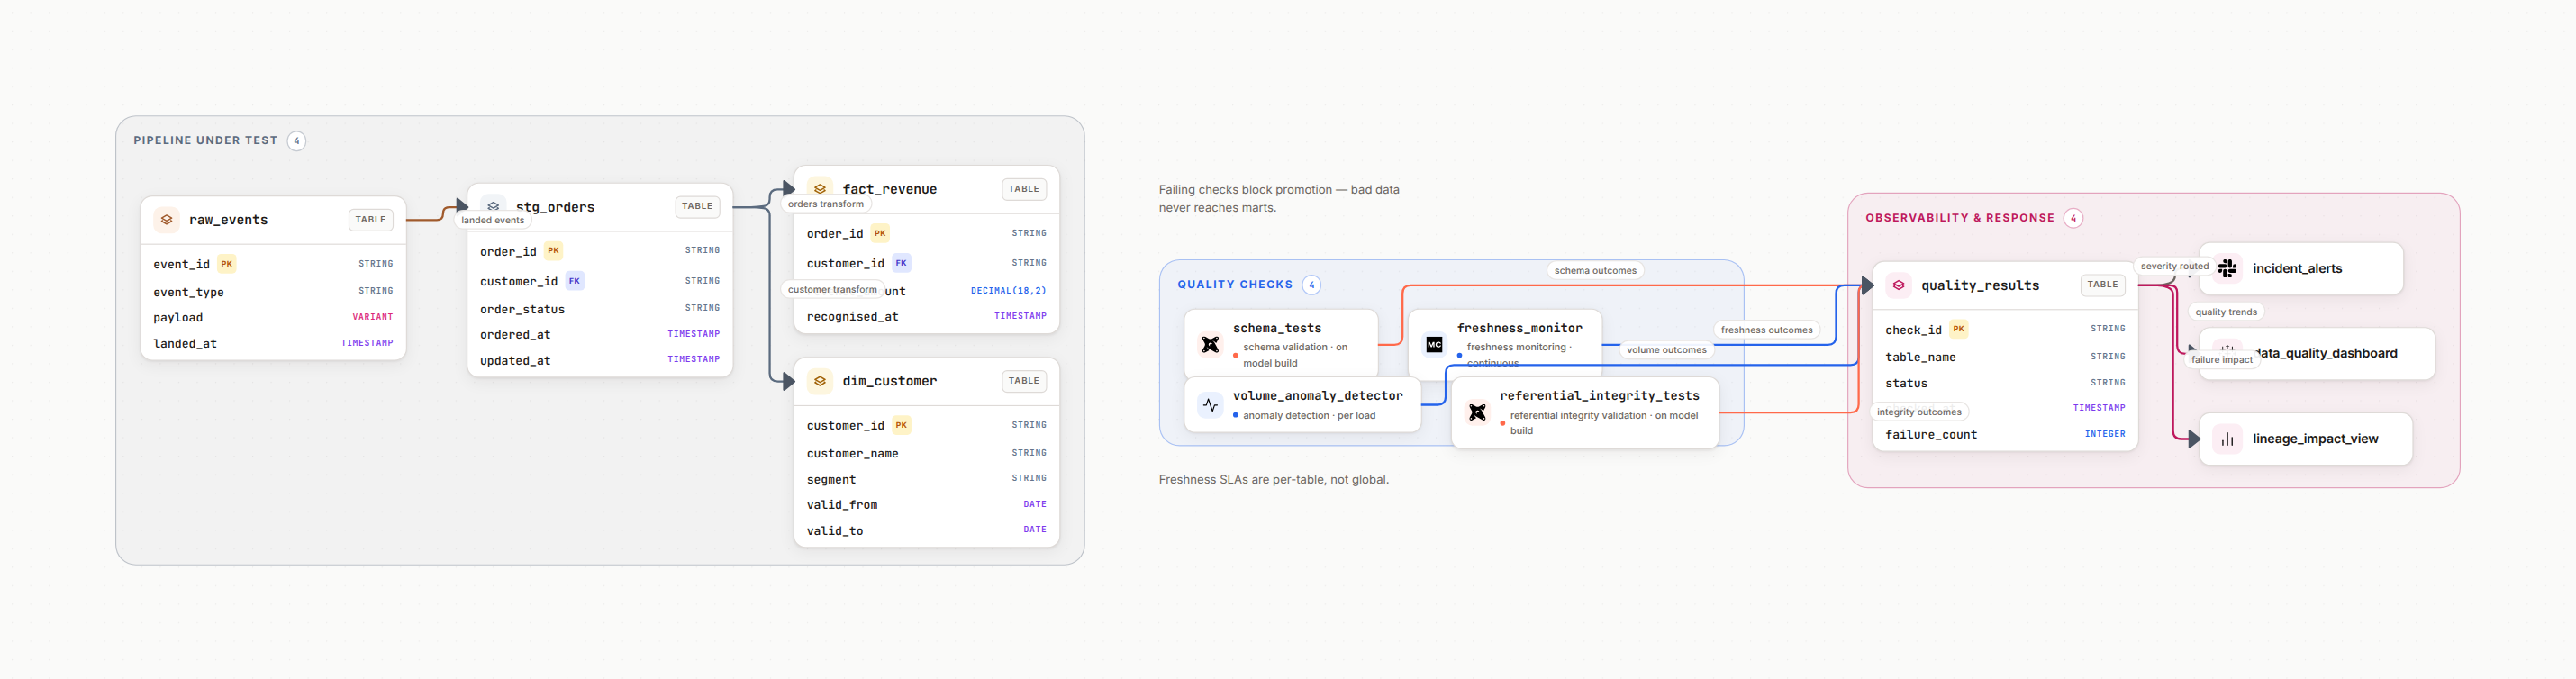
At the boundaries: validate data when it enters your system and when it leaves. That catches both upstream issues and transformation bugs, and it keeps intermediate models out of the alert path, where a failing test on something nobody consumes is information for a pull request rather than a page. In an ETL pipeline the boundaries are the extract landing zone and the published mart; in ELT they are the raw schema and the serving layer. Deciding where checks go is much easier with a data pipeline diagram in front of you; the boundaries are obvious once drawn.
Stage 1: Source Validation (Ingestion)
Test data as it arrives from external systems. This is your first line of defense against upstream issues, and detecting here is what makes the incident attributable to the source team rather than the data team. Better still, push the expectation upstream as a data contract so producers catch violations before you do.
What to check:
- • Schema matches expected (no new/missing columns)
- • Row count within expected range
- • Required fields are non-null
- • Data arrived on time (freshness)
Stage 2: Transformation Tests
Test the output of your transformations. This catches logic bugs in your SQL or Python, the class of failure that produces confidently wrong numbers rather than an empty table.
What to check:
- • Primary keys are unique (no fan-out)
- • Aggregations sum correctly
- • Business rules are enforced
- • Referential integrity maintained
Stage 3: Output Validation (Delivery)
Test data before it reaches dashboards and consumers. This is your last chance to catch issues, and the only stage whose failures are visible to the people who trust the numbers.
What to check:
- • Metrics are within expected bounds
- • No anomalies vs. historical patterns
- • Critical dashboards have data
- • SLAs are met
Pro Tip
Fail Fast, Fail Loud
It is better for a pipeline to fail at 6 AM with a clear error than to silently produce bad data that gets discovered in a board meeting. Configure tests to block bad data from propagating downstream, and reserve the warning level for data that is odd rather than unusable.
5. How Often Should Data Quality Checks Run: Daily, Weekly, or Monthly?
Cadence follows cost and purpose, not habit. Anything that can block a dashboard runs with the pipeline, on every execution, because a clock-driven check on a pipeline that runs more often than the clock serves bad data in between. A nightly sweep on an hourly pipeline means up to eleven hours of unverified data reaching consumers. Anything that compares two systems runs daily, once both sides have landed. Anything about trend runs weekly. Anything about the health of the test suite itself runs monthly.
| Cadence | What Runs | Why This Cadence |
|---|---|---|
| Every pipeline run | Source freshness and volume, schema drift, not_null and unique on keys, accepted values on enums a mart depends on | These block the run. They fire because the run happened, so nothing is ever served unverified |
| Daily | Reconciliation against the source of record on money tables, cross-system row counts, orphaned foreign keys, confirmation that every critical dashboard table refreshed | Needs both systems to have finished loading, and is too expensive to run hourly |
| Weekly | Null-rate trend per column, distribution drift on segmentation fields, duplicate rate, test pass rate per model, tests that failed and were re-run without a fix | Trends need several points to mean anything, and a weekly view exposes the slow degradations no single run catches |
| Monthly | Threshold review against what actually fired, coverage report on critical tables with no check, tests with no owner, delivered freshness against the promised SLA | This is maintenance of the suite itself, and skipping it is how thresholds drift into noise |
| Quarterly | Retire tests that have never fired and never will, renegotiate freshness SLAs with source teams, re-rank which tables count as critical | The pipeline and the business both moved; the test suite should follow rather than accumulate |
One practical constraint: expensive checks on incremental models should scan the partitions that changed, not full history. Cross-system reconciliation over the last seven days answers the same question as reconciliation over three years, at a fraction of the warehouse cost, and a check that is too expensive to run is a check that gets disabled.
6. How to Monitor Data Freshness and Accuracy
These two get asked together and need completely different mechanics. Freshness is measurable from inside the warehouse. Accuracy is not, because the warehouse holds no independent truth to compare against.
Freshness: two clocks
The first is data age: max(updated_at) or the event timestamp, compared against wall clock. The second is whether the job ran at all, measured from the last successful pipeline execution. You need both. A pipeline that fails before it writes leaves yesterday data in a valid-looking table with every content test green, and only the wall-clock comparison catches it.
Set the threshold from what the consumer was promised, not from the schedule. An hourly job under a 24 hour SLA does not deserve a page at 65 minutes.
Accuracy: three approximations
Reconcile against the source of record: count and sum per day for the last seven days, compared with the operational database or the vendor API. Assert invariants that must hold internally: order total equals the sum of line items, balance equals credits minus debits, funnel step N never exceeds step N minus 1. Compare against known-good published numbers: last month closed revenue should not move.
A tolerance is part of the check. Reconciliation that demands exact equality against a system with its own late-arriving data fails every morning and teaches people to ignore it.
Write the outcome of every check to a results table: timestamp, table, check name, pass or fail, observed value. Without that history you can say whether quality is green this morning, but not whether it improved this quarter, and the second question is the one you will be asked.
7. How to Alert on Data Quality Without Alert Fatigue
The biggest risk with data quality monitoring is not missing issues, it is alert fatigue. Too many false positives and your team starts ignoring alerts, at which point the suite has negative value: it costs money and creates the belief that something is watching.
Explicit checks catch the failures you thought of. The ones you did not are caught by signals nobody wrote a test for: a table that stopped arriving, a row count that halved, a schema that gained a column overnight. That is the difference between quality testing and data observability, and the two answer different questions. If you are drawing the monitoring side of the platform, the data observability platform diagram generator lays out collectors, checks and alert routing as a starting point.
Do This
- • Tier your alerts: P1 (page), P2 (Slack), P3 (email digest)
- • Use anomaly detection for metrics that vary naturally
- • Include context in alerts: what broke, impact, runbook link
- • Set appropriate thresholds based on historical data
- • Review and tune alert thresholds monthly
Avoid This
- • Paging on every failed test
- • Hard-coded thresholds that do not adapt
- • Alerts without clear ownership
- • Ignoring "flaky" tests instead of fixing them
- • Missing runbooks for common failures
Alert Severity Framework
P1 - Page Now
Data is wrong in production dashboards. Executives are affected. Revenue impact.
P2 - Slack Alert
Data quality degraded but not critically broken. Should fix within 4 hours.
P3 - Daily Digest
Minor issues, informational. Review in next sprint. No immediate action needed.
A useful rule for assigning a tier: ask what the on-call person would do at 3 AM. If the answer is anything other than fix it now, the check is not P1. Freshness on a table feeding a board dashboard is P1. A null-rate drift of 3% on an optional column is P3, and paging on it is how the P1 stops being read.
From experience
I once joined a team with 200+ data quality alerts per day. Everyone ignored them. We cut it to 15 high-signal alerts and suddenly the team started fixing issues the same day. Less is more.
8. How to Expose Data Quality Metrics to Stakeholders
Nobody outside the data team reads test output, and a link to a testing tool that needs an account gets clicked once. Four numbers per data product carry the whole message, and they belong wherever stakeholders already look: the top of the dashboard, the Confluence page, the team channel.
As of
The timestamp of the newest row in the data product, not the time the page rendered. This single line answers the question that generates most of the ad hoc questions a data team receives.
Check pass rate
The share of checks on this product that passed on the last run. Report it per product, not globally, because a global 98% hides the 2% that is the revenue table.
Open incidents
What is currently known to be wrong, who owns it, and when it is expected to be fixed. A known issue that is stated loses far less trust than one a stakeholder discovers.
Coverage
The share of critical tables carrying at least one check. This is the number that gets a quality programme funded, because it makes the gap visible rather than theoretical.
The second thing that works is showing where the checks are. A pipeline diagram with the quality gates marked answers "is this number checked" faster than any status page, and it answers it for people who will never open the testing tool. The failure mode is the diagram itself going stale: a screenshot drawn in March describes a pipeline that has since gained two sources.
This is the part Datadef handles. Describe the pipeline and its quality gates in plain language and it draws the diagram, or connect the GitHub, GitLab or Azure DevOps repository read-only and it regenerates the diagram daily from the code. A live embed puts it in a README, Notion or Confluence page on one line of markdown, and the image follows the canvas, so the quality gates a stakeholder sees are the ones that exist today. Readers do not need an account.
9. Which Data Quality Tools Catch Pipeline Issues Before Broken Data Reaches Dashboards?
Two categories, and the honest answer is that most teams need one from each. Testing tools check what you declared and can block a run, which is what stops bad data reaching a dashboard. Observability platforms learn the normal pattern and flag deviation nobody wrote a rule for, which is what catches the incident class you did not anticipate. Buy the second only after the first has owners, otherwise you get anomaly alerts on tables nobody is responsible for.
| Tool | Best For | Approach | Model |
|---|---|---|---|
| dbt tests | Transformation testing | Schema + custom tests | Open source |
| Great Expectations | Comprehensive validation | Expectation suites | Open source |
| Monte Carlo | Data observability | ML anomaly detection | Commercial |
| Soda | Data monitoring | SodaCL checks | Open source core, commercial cloud |
| Elementary | dbt-native observability | Anomaly detection | Open source core, commercial cloud |
dbt tests or Great Expectations?
This comes up on every stack decision, and it is not either/or. dbt tests are YAML declarations living next to the model, run with dbt build, and they fail the run, which is the right fit for anything already transformed inside the warehouse. Great Expectations is a Python library whose expectation suites run against pandas, Spark or a SQL connection, so it validates files, API extracts and streams before they land, and it produces a documentation site from the suites. Teams already on dbt normally start with dbt tests, keep them for everything in the warehouse, and add Great Expectations only at the edges where data has not arrived yet.
Proactive Testing
You define the rules. Tests run on every pipeline execution. Explicit, deterministic, and able to block the run.
Tools: dbt tests, Great Expectations, Soda
Anomaly Detection
Machine learning learns "normal" patterns and alerts on deviations. Catches unknown unknowns, at the cost of a warm-up period.
Tools: Monte Carlo, Elementary, Bigeye
10. How Long Does It Take to Implement a Data Quality Testing Framework?
The first useful checks take a day. A framework the team trusts takes a quarter. The gap between those two numbers is not tooling, it is ownership and alert routing, which is exactly the part that gets deferred.
Day 1 to week 1
Four checks on five tables
Freshness, row volume, primary key uniqueness and not_null on the five tables behind the dashboards leadership opens. Twenty tests, no new infrastructure if you already run dbt. This is the point at which you start catching real incidents.
Weeks 2 to 4
Routing, owners, runbooks
Decide which failures page and which go to a digest, name an owner per table, and write the runbook for each check. Teams skip this step and it is the single reason attempt one gets muted three months later.
Month 2
Extend and shift left
Add accepted values, referential integrity and schema drift across the critical layer. Put tests in CI so a pull request that breaks a model fails before merge rather than at 6 AM in production.
Month 3
Anomaly detection and reporting
Add anomaly detection on the metrics that vary naturally, publish coverage and pass rate per data product, and run the first monthly threshold review. Now the framework is measurable and can be defended in a planning meeting.
Timelines slip for two reasons, and neither is technical. The first is no owner: a failing test that belongs to everybody is a notification. The second is starting with coverage instead of impact, because four hundred tests in week one produce noise, no trust, and a backlog of yellow that nobody will ever triage.
11. Quality, Lineage, and Contracts: What to Put in Place Across a Platform
Checks catch the break. Three surrounding practices decide how expensive the break is, and they are what a data leader is really being asked about when the question is framed at platform scale rather than table scale.
Contracts at the source
Move the expectation upstream so it lives with the producer, and a violation becomes their build failure rather than your 6 AM incident. This is the only practice on the list that reduces the number of breaks rather than the time to find them. See the data contracts guide for the schema and SLA fields worth agreeing on.
Lineage, so a failure names its blast radius
Without lineage, a failed check starts an investigation. With it, the alert already lists the models and dashboards downstream, which turns triage into a decision about whether to hold the refresh. Column-level lineage is what makes that list short enough to act on. The data lineage best practices guide covers how far to take it.
An owner and a service level per data product
Publish, for each data product, who owns it and what freshness it promises. An SLA that is written down is a check you can run; an SLA that is understood informally is an argument after the fact. Keep the checks themselves in version control, reviewed in pull requests and deployed with the pipeline, rather than configured in a UI whose history nobody can diff.
12. Frequently Asked Questions
What are the best practices data engineers use to manage data quality?
Test at the boundaries, on ingestion and on the published output. Start with the tables behind the dashboards leadership opens, not with full coverage. Combine declared rules with anomaly detection. Tier alerts so only wrong numbers in production page someone. Give every check an owner and a runbook. Keep the checks in version control, run them in CI, and review thresholds monthly.
What are the key dimensions of data quality?
Six dimensions: completeness (no missing values in required fields), accuracy (values match the source of record), consistency (one format and one set of enum values everywhere), timeliness (the newest row is inside the freshness window), validity (values obey business rules such as a positive price), and uniqueness (the primary key is unique and no order is loaded twice). Each maps to a testable assertion.
What are the types of data quality checks?
Six types cover most production incidents: freshness (time since the newest row), row volume against a recent range, schema drift (a column added, removed or retyped), null rate on required columns, primary key uniqueness, and accepted values or ranges on enums and numeric fields. Referential integrity and cross-system reconciliation are the two worth adding next.
What are the best data quality tools for catching pipeline issues before broken data reaches dashboards?
Two categories, and most teams need both. For declared checks that block a run: dbt tests inside a dbt project, Great Expectations for validation outside the warehouse, and Soda for checks written in SodaCL. For the failures nobody wrote a rule for: Monte Carlo, Bigeye, and Elementary learn the normal pattern and flag deviation. Start with declared checks, add anomaly detection once they have owners.
Should you use dbt tests or Great Expectations?
dbt tests are YAML next to the model, run with dbt build, and fail the run, which suits anything already transformed inside the warehouse. Great Expectations is a Python library whose expectation suites validate pandas, Spark or a SQL connection, so it can check files and extracts before they land. Teams on dbt usually start with dbt tests and add Great Expectations only at the edges.
How often should data quality checks run, daily, weekly or monthly?
Blocking checks run on every pipeline execution, not on a clock, so nothing is served unverified. Reconciliation against source systems runs daily, once both sides have landed. Null rate trends, distribution drift and test pass rates run weekly. Threshold tuning, coverage gaps and unowned tests are a monthly review. A nightly check on an hourly pipeline serves eleven hours of bad data.
How do you monitor data freshness and accuracy?
Freshness needs two clocks: the age of the newest row, and whether the job ran at all. A pipeline that fails before writing leaves yesterday data looking perfectly valid and every content test green. Accuracy cannot be tested from inside the warehouse alone, so reconcile counts and sums against the source of record, assert invariants such as order total equal to the sum of line items, and check that closed periods do not move.
Should data quality checks run before or after transformations?
Both. Run source checks before transformation to catch upstream issues early and fail fast, which also makes the incident attributable to the producing team. Run output checks after transformation to validate business logic and catch fan-out joins. This test at the boundaries approach catches issues at both the ingestion and the delivery point, where the cost of missing them is highest.
How do you implement data quality checks in a production pipeline without slowing it down?
Run cheap assertions on every execution and expensive ones on a schedule. Uniqueness, null rate and accepted values scan one table and cost seconds. Cross-system reconciliation and distribution comparisons are the expensive ones, so run them daily on the partitions that changed rather than on full history. Test incremental models on the new partition, and keep full-table scans for the weekly sweep.
How long does it take to implement a data quality testing framework?
The first useful checks take a day: freshness, volume, key uniqueness and not null on the five tables behind the dashboards leadership opens. Alert routing, ownership and runbooks take the rest of the first month, and that is the step teams skip. Expect a quarter before the framework is trusted, with anomaly detection and coverage reporting added last.
How do you measure data quality?
Record the result of every check as a row: timestamp, table, check, outcome. From that table you can report four numbers stakeholders understand: freshness per data product, the pass rate of its checks, open incidents with an expected fix time, and coverage, meaning the share of critical tables carrying at least one check. Track mean time to detection and to resolution alongside them.
What is the best way to expose data quality metrics to stakeholders?
Publish four numbers where stakeholders already look rather than in a tool needing an account: as of when the data is current, the pass rate on its checks, open incidents with an expected fix, and test coverage on critical tables. Pair them with a pipeline diagram showing where the quality gates sit, which answers is this number checked faster than any status page.
What should a data leader put in place for quality and lineage across enterprise pipelines?
Three things, in order. Data contracts at the source, so the expectation lives with the producer and a violation is their failure. Lineage, so a failed check names the dashboards and models affected instead of starting an investigation. An owner and a service level per data product. Keep the checks in version control so they are reviewed and deployed like code.
Document Your Data Quality Strategy
Build clear diagrams of your data pipelines with quality checkpoints marked. Show stakeholders exactly where and how data gets validated.
Related Guides
Data Quality Checks That Matter
The six checks worth an alert, and the two boundaries to run them at
Data Pipeline Documentation
Document pipelines that new hires can debug on day one
Data Lineage Best Practices
Track data from source to dashboard
Data Contracts
Define data quality SLAs with formal contracts
Medallion Architecture
Layer data quality with Bronze, Silver, Gold zones
ML Pipeline Architecture
Apply quality monitoring to ML feature pipelines