The short answer
Dimensional modeling is Ralph Kimball's method for designing analytical tables around how people ask questions: numeric measurements go in fact tables, the descriptive context used to filter and group them goes in dimension tables, and the two are joined on surrogate keys. A star schema is the shape that method produces, one fact table surrounded by denormalized dimensions, so "Kimball vs star schema" is not a real choice: Kimball is the method, the star schema is its output. You design one by following four steps in order: select a single business process, declare the grain (one row per what), identify the dimensions that describe that event, then identify the numeric facts that are true at that grain. A snowflake schema is the same star with its dimensions normalized into sub-tables, which saves storage and costs joins, and is generally not worth it on a columnar warehouse. The decisions that remain are whether a fact is additive, semi-additive, or non-additive across dimensions, which dimensions have to be conformed so several fact tables can be compared, and how each dimension handles history: type 1 overwrites, type 2 adds a row with validity dates, type 3 keeps a previous-value column.
1. Kimball vs Star Schema: What Is the Difference?
There is no choice to make here, and that is the whole answer. Kimball is a design method. Dimensional modeling is the name of the technique at the center of that method. A star schema is the physical table layout the technique produces. You do not pick one of the three: you follow the method, and a star schema is what lands in the warehouse. The same goes for "star schema vs dimensional model": the star is the default physical form of a dimensional model, and a snowflake or a wide table are the two other forms the same logical model can take.
| Term | What it actually names |
|---|---|
| Dimensional modeling | The technique: split measurements from context, put measurements in facts, context in dimensions, join on surrogate keys. |
| The Kimball method | The lifecycle around the technique: the four-step design process, the bus matrix, conformed dimensions, and building the warehouse one business process at a time. |
| Star schema | The output: one fact table joined directly to denormalized dimension tables. The shape on the diagram. |
| Snowflake schema | The same star with dimensions normalized into sub-tables. A physical variant, not a different method. |
| Inmon (CIF) | The genuine alternative method: a normalized enterprise warehouse first, dimensional marts downstream. "Kimball vs Inmon" is a real comparison in a way that "Kimball vs star schema" is not. |
Short version
Kimball is the verb, the star schema is the noun. If someone asks you to "use Kimball", they are asking for facts, dimensions, declared grain, conformed dimensions, and SCD handling. If they ask you for "a star schema", they are describing the diagram they expect at the end.
2. What Is Dimensional Modeling in the Kimball Method?
Dimensional modeling is a technique for designing data warehouses that prioritizes query simplicity and performance over storage efficiency. Created by Ralph Kimball in the 1990s and set out in The Data Warehouse Toolkit, it remains the default for analytics because it models data the way business users think about it. In a modern lakehouse, this is what your Gold layer looks like: dimensional models sit downstream of the cleaned Silver tables in a medallion architecture.
Why Not Just Use 3NF?
Third Normal Form (3NF) is great for OLTP systems: it minimizes redundancy and prevents update anomalies. But it's terrible for analytics: queries require 15+ joins, performance degrades, and analysts can't understand the model without a PhD in your schema.
The core principle: separate the "what happened" from the "context"
Fact Tables
Store events and measurements: orders placed, clicks, payments. Contain metrics you can aggregate (sum, count, average).
Dimension Tables
Store descriptive context: who (customers), what (products), when (dates), where (locations). Enable filtering and grouping.
The Kimball philosophy
"The data warehouse is only as good as the business intelligence it enables." Dimensional models are designed for humans first, computers second. If an analyst can't write a query without help, the model has failed.
3. Fact Table vs Dimension Table in a Star Schema
The two building blocks of every star schema. Get this split right and everything else follows.
Fact Tables
- Record business events/transactions
- Contain numeric measures (amount, quantity, duration)
- Have foreign keys to dimension tables
- Very tall and narrow (many rows, few columns)
- Grain = one row per event
Examples:
fct_orders, fct_page_views, fct_payments
Dimension Tables
- Store descriptive attributes
- Contain text fields for filtering/grouping
- Have a surrogate key as primary key
- Short and wide (fewer rows, many columns)
- Grain = one row per entity
Examples:
dim_customers, dim_products, dim_date
| Question | If Answer Is... | It's a... |
|---|---|---|
| Can you SUM/COUNT/AVG it? | Yes | Fact |
| Would you GROUP BY or FILTER on it? | Yes | Dimension |
| Does it describe an entity? | Yes | Dimension |
| Does it record an event/transaction? | Yes | Fact |
Example: E-commerce Order
-- Fact table: one row per order line item
CREATE TABLE fct_order_lines (
    order_line_sk       BIGINT PRIMARY KEY,    -- Surrogate key
    order_id            VARCHAR(50),           -- Natural key (degenerate dimension)
    customer_sk         BIGINT REFERENCES dim_customers,
    product_sk          BIGINT REFERENCES dim_products,
    date_sk             INT REFERENCES dim_date,
    -- Measures (aggregatable)
    quantity            INT,
    unit_price          DECIMAL(10,2),
    discount_amount     DECIMAL(10,2),
    line_total          DECIMAL(10,2)
);

-- Dimension table: one row per customer
CREATE TABLE dim_customers (
    customer_sk         BIGINT PRIMARY KEY,    -- Surrogate key
    customer_id         VARCHAR(50),           -- Natural key
    customer_name       VARCHAR(255),
    email               VARCHAR(255),
    segment             VARCHAR(50),           -- 'Enterprise', 'SMB', 'Consumer'
    acquisition_channel VARCHAR(50),
    created_at          TIMESTAMP
);
Additive, semi-additive, non-additive facts
Not every number in a fact table can be summed across every dimension. Kimball sorts measures into three kinds, and the distinction is what stops a dashboard from reporting a number nobody can reproduce.
| Kind | Can be summed across | Example |
|---|---|---|
| Additive | Every dimension | line_total, quantity |
| Semi-additive | Some dimensions, never date | account_balance, inventory_on_hand (sum across stores, average or take the last value across days) |
| Non-additive | No dimension | margin_percent, conversion_rate. Store the numerator and denominator as additive facts and compute the ratio after aggregation. |
4. How to Design a Star Schema: Kimball's Four Steps
A star schema places a fact table at the center, surrounded by dimension tables. The name comes from the shape: fact in the middle, dimensions radiating outward like points of a star. Kimball gets there with four decisions taken in a fixed order, and the order matters: each step narrows the next one.
Select the business process
One process that a source system records: order taking, shipping, invoicing, support ticket handling. Not a department ("marketing"), not a report ("the weekly revenue deck"). Modeling around a department produces tables that answer only that department's current questions; modeling around a process produces tables every department can reuse.
Declare the grain
Write one sentence: "one row per product per sales transaction line". Declare it before you list a single column, and pick the lowest atomic grain the source can give you, because aggregates can be derived from atoms and atoms cannot be recovered from aggregates. Every column added later must be true at that grain, which is the test that keeps a fact table honest.
Identify the dimensions
Ask what describes the event at that grain: who, what, when, where, how. For a retail line item that is date, store, product, customer, promotion, and cashier. Each becomes a foreign key in the fact table. If an attribute is not true at the declared grain, it belongs to a different fact table.
Identify the facts
The numeric measurements the process produces: quantity, unit price, discount amount, extended line total. Keep them additive where you can, and store components rather than ratios so the ratio can be recomputed after aggregation. Anything textual you were tempted to put here is a dimension attribute or a degenerate dimension.
The mixed-grain mistake
The most expensive error in dimensional modeling is putting an order-level value, such as shipping cost or an order discount, into a line-level fact table. Every report that sums it multiplies it by the number of lines on the order. Either allocate the value down to the line, or keep a second fact table at order grain and compare the two by drilling across.
Where the star sits inside the warehouse, and how many of them you end up with, is a separate decision from how each one is shaped; the data warehouse design guide covers the layering and naming conventions around it. If you want to see the shape before you write the DDL, the star schema diagram generator takes a list of facts and dimensions and lays out the join paths.
Star Schema Structure
dim_date
dim_customer
fct_orders
dim_product
dim_store
Fact table at center, dimensions around it: simple joins, intuitive queries
The four steps on a worked example
| Step | Retail sales | SaaS subscriptions |
|---|---|---|
| Business process | A customer buys at the register | An invoice is issued for a subscription period |
| Grain | One row per product per transaction line | One row per invoice line per billing period |
| Dimensions | date, store, product, customer, promotion, cashier | date, account, plan, currency, sales_rep |
| Facts | quantity, unit_price, discount_amount, line_total | seats, unit_price, discount_amount, billed_amount |
To sketch your own model, the star schema generator draws a fact-and-dimensions diagram from a one-line description that you can then edit table by table. If the tables already exist, paste their CREATE TABLE statements into the SQL to ER diagram tool instead: the star is drawn exactly from the DDL, and fact-to-dimension links are read from the key names when the warehouse declares no foreign keys.
Surrogate keys are step zero
Every dimension gets a meaningless integer primary key generated by the warehouse, and the fact table stores that key rather than the source system identifier. This is what lets a customer exist as several dimension rows under SCD Type 2, survives a source system migration that renumbers its own ids, and keeps joins on fixed-width integers. Store the natural key next to it as an attribute.
5. Kimball Star Schema vs Snowflake Schema
A snowflake schema is the same dimensional model with its dimensions normalized. Instead of one dim_product carrying category and department as columns, you get dim_product joined to dim_category joined to dim_department. Nothing about the facts changes. What changes is the number of joins an analyst has to write and the number the engine has to run.
Star Schema (Preferred)
- • Dimensions are denormalized
- • Fewer joins = faster queries
- • Easier to understand and query
- • Slight data redundancy (OK for analytics)
Snowflake Schema
- • Dimensions are normalized
- • More joins = slower queries
- • Harder to query without documentation
- • Saves storage (rarely matters today)
Same report, star then snowflake
-- Star: revenue by department, one join
SELECT p.department, SUM(f.line_total)
FROM fct_order_lines f
JOIN dim_products p ON f.product_sk = p.product_sk
GROUP BY p.department;

-- Snowflake: same report, three joins
SELECT dp.department_name, SUM(f.line_total)
FROM fct_order_lines f
JOIN dim_products    p  ON f.product_sk  = p.product_sk
JOIN dim_categories  c  ON p.category_sk = c.category_sk
JOIN dim_departments dp ON c.department_sk = dp.department_sk
GROUP BY dp.department_name;
The storage argument for snowflaking rarely survives arithmetic. A retailer with 300,000 products and three billion order lines keeps roughly one dimension row per ten thousand fact rows, so normalizing the category text out of the product dimension saves a fraction of a percent of total warehouse storage. On a columnar engine it saves even less, because dictionary encoding already stores each repeated category string once per block. The join you added, on the other hand, is paid on every query an analyst runs.
Pro Tip
When to Snowflake
Only snowflake when dimensions are truly hierarchical AND analysts frequently query at different levels independently (e.g., product → category → department). Otherwise, denormalize everything into the dimension table.
Two other cases are usually accepted. An outrigger, where one dimension references another small dimension (a customer dimension pointing at a date dimension for the account opening date), keeps the calendar attributes in one place instead of copying twenty columns. And a dimension that arrives already normalized from an MDM system is sometimes left that way and exposed to analysts through a flattened view, which gives the star experience over snowflaked storage. To see either layout drawn out, the snowflake schema diagram generator renders the normalized branches next to the fact table.
6. Types of Dimensions in the Kimball Method
Not all dimensions are created equal. Understanding these patterns helps you model correctly from the start.
Conformed Dimensions
Shared across multiple fact tables. dim_date, dim_customer used by fct_orders, fct_page_views, fct_support_tickets. The key to enterprise consistency, and the subject of section 7.
Role-Playing Dimensions
Same dimension used multiple times with different meanings. dim_date joined as order_date, ship_date, delivery_date. Create views or aliases.
Degenerate Dimensions
Dimension keys stored in the fact table without a separate dimension table. Order numbers, invoice IDs, transaction IDs. No attributes worth storing separately.
Junk Dimensions
Combines miscellaneous low-cardinality flags into one dimension. Instead of 5 boolean columns in the fact table, create dim_order_flags with all combinations.
Date Dimension
The most important dimension. Pre-calculated attributes: day_of_week, is_weekend, fiscal_quarter, holiday_flag. Always use integer surrogate keys (YYYYMMDD format). Section 8 covers how to build it.
Outrigger Dimensions
A dimension referenced from inside another dimension, such as dim_customer holding a date key for the account opening date. The one snowflake Kimball accepts without argument. Use it sparingly, and never for the primary hierarchy of the dimension.
Bridge Tables (Many-to-Many)
For the cases where one fact row genuinely relates to several dimension members: multiple diagnoses on a hospital visit, several authors on a book, a customer account with several holders. A bridge table sits between fact and dimension with a weighting factor so measures can be allocated instead of double counted.
7. Conformed Dimensions and the Kimball Bus Matrix
A dimension is conformed when several fact tables use the same dimension table, or dimension tables whose keys and attribute values mean exactly the same thing. That is what turns a pile of separate stars into one warehouse: if fct_orders and fct_support_tickets both join dim_customer, then "Enterprise segment" means the same customers on both sides and the two processes can be compared. Conformed dimensions are the Kimball answer to the question that kills most warehouses, which is why two teams report two different numbers for the same word.
The bus matrix: plan the whole warehouse on one page
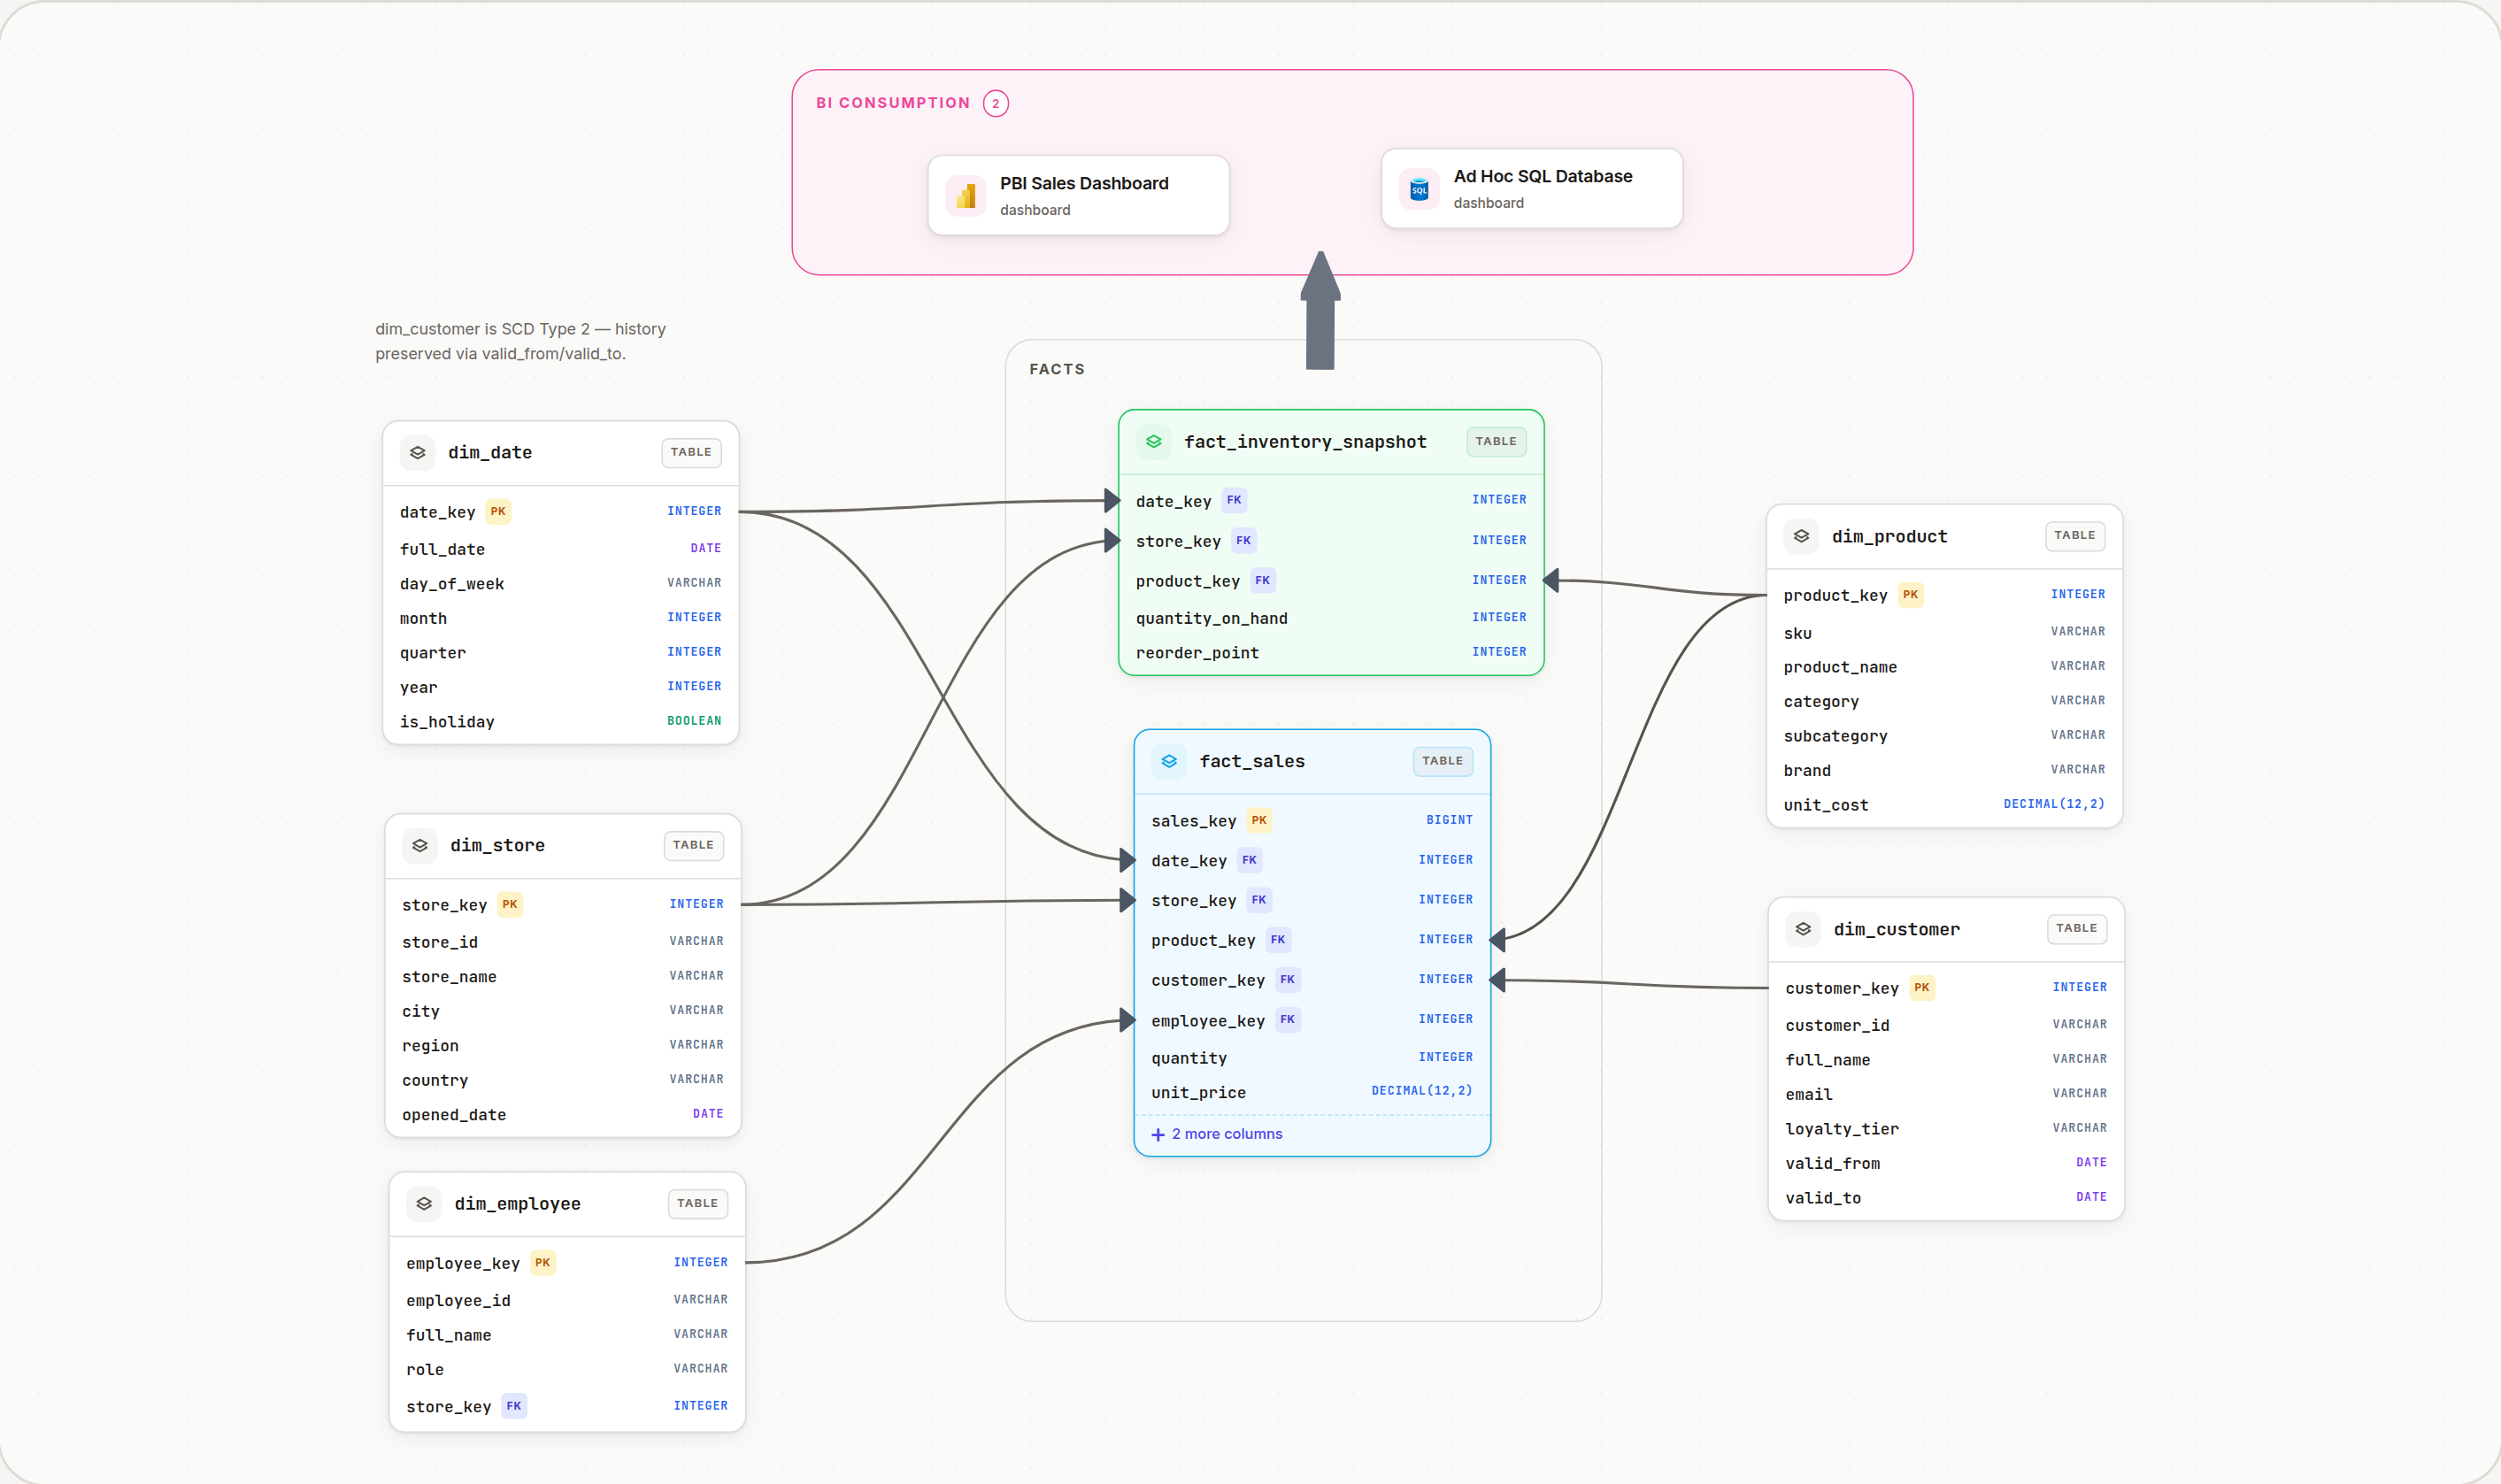
Before a single table exists, draw a grid. Rows are business processes, each of which becomes one fact table. Columns are the dimensions. Mark every cell where a process uses a dimension. The columns with several marks are the dimensions that must conform, and they are the ones to build first, because everything else depends on them. The rows give you a delivery order: ship one star, then the next, each reusing dimensions that already exist.
| Business process (fact table) | Date | Customer | Product | Store | Promotion |
|---|---|---|---|---|---|
| Order taking | X | X | X | X | X |
| Shipping | X | X | X | . | . |
| Returns | X | X | X | X | . |
| Support ticket handling | X | X | X | . | . |
| Inventory snapshot | X | . | X | X | . |
Read the matrix above and the build order writes itself: date, customer, and product are used by nearly every process, so they are conformed dimensions and get built first, with a single owner and a single definition. Store and promotion are used by fewer processes and can wait.
Multi fact star schemas: drill across, never join fact to fact
A warehouse with several fact tables sharing conformed dimensions is sometimes called a fact constellation or galaxy schema. It is normal and expected. The rule that comes with it is absolute: never join two fact tables directly. Their grains differ, so the join multiplies rows and every measure on both sides inflates. Kimball's technique is drilling across: query each star separately, group both results by the same conformed dimension attributes, then join the two summarized result sets on those attributes.
Drilling across two fact tables
-- WRONG: joining two fact tables multiplies rows
-- SELECT SUM(o.line_total), SUM(r.refund_amount)
-- FROM fct_order_lines o JOIN fct_returns r ON o.product_sk = r.product_sk

-- RIGHT: aggregate each star, then join on conformed attributes
WITH orders AS (
    SELECT d.year_num, d.month_num, p.category,
           SUM(f.line_total) AS revenue
    FROM fct_order_lines f
    JOIN dim_date     d ON f.date_sk    = d.date_sk
    JOIN dim_products p ON f.product_sk = p.product_sk
    GROUP BY 1, 2, 3
),
returns AS (
    SELECT d.year_num, d.month_num, p.category,
           SUM(f.refund_amount) AS refunds
    FROM fct_returns f
    JOIN dim_date     d ON f.date_sk    = d.date_sk
    JOIN dim_products p ON f.product_sk = p.product_sk
    GROUP BY 1, 2, 3
)
SELECT COALESCE(o.year_num, r.year_num)   AS year_num,
       COALESCE(o.month_num, r.month_num) AS month_num,
       COALESCE(o.category, r.category)   AS category,
       COALESCE(o.revenue, 0)             AS revenue,
       COALESCE(r.refunds, 0)             AS refunds
FROM orders o
FULL OUTER JOIN returns r
  ON  o.year_num  = r.year_num
  AND o.month_num = r.month_num
  AND o.category  = r.category;
Drawing a multi-star model
A bus matrix is a plan, not a picture of the tables. When you need the picture, the star schema diagram generator draws each business process as its own zone on an editable canvas, with the conformed dimensions placed once and connected to every fact table that uses them, which is exactly the shape the matrix implies. A one-line markdown embed then keeps that diagram live in the repository README or the Confluence page where the model is documented, so it follows the canvas when a dimension is added.
8. The Kimball Date Dimension
Every dimensional model has one, and it is the dimension people get wrong most often. The point is not to store the date, the fact table already has a key for that. The point is to store everything a report might want to group or filter by that SQL cannot derive from a date alone: fiscal periods that do not follow the calendar, company holidays, trading days, the name of the week in the language the report is written in.
Integer key in YYYYMMDD form
20260819 sorts correctly, is readable in a raw fact table during debugging, and partitions and prunes well. It is the one place Kimball allows a surrogate key to carry meaning.
One row per day, loaded once
From before the earliest fact to several years ahead. Twenty years is about 7,300 rows, so the table is generated once and extended occasionally, never joined on a computed expression.
Special rows, never null keys
Add rows for "date unknown" and "not yet occurred" with reserved negative keys. Accumulating snapshot facts need them, since a ship date is empty until the order ships and a null foreign key breaks the join.
Time of day goes elsewhere
Putting minutes into dim_date multiplies its rows by 1,440. Keep a separate dim_time_of_day, or store a plain timestamp on the fact when nobody groups by hour buckets.
The date dimension is also the classic role-playing dimension: an order fact joins it three or four times as order_date, ship_date, delivery_date. Build one physical table and expose one view per role, so each role can carry its own column names in the BI tool.
Example: Date Dimension
CREATE TABLE dim_date (
    date_sk             INT PRIMARY KEY,       -- YYYYMMDD format
    date_actual         DATE NOT NULL,
    day_of_week         VARCHAR(10),           -- 'Monday', 'Tuesday', ...
    day_of_week_num     INT,                   -- 1-7
    day_of_month        INT,
    day_of_year         INT,
    week_of_year        INT,
    month_num           INT,
    month_name          VARCHAR(10),
    quarter_num         INT,
    quarter_name        VARCHAR(10),           -- 'Q1', 'Q2', ...
    year_num            INT,
    fiscal_year         INT,
    fiscal_quarter      INT,
    is_weekend          BOOLEAN,
    is_holiday          BOOLEAN,
    holiday_name        VARCHAR(50)
);

-- Usage: easily filter/group by any date attribute
SELECT
    d.month_name,
    d.year_num,
    SUM(f.order_total) as revenue
FROM fct_orders f
JOIN dim_date d ON f.order_date_sk = d.date_sk
WHERE d.is_weekend = FALSE
GROUP BY d.month_name, d.year_num;
9. Slowly Changing Dimensions (SCD Types 0 to 6)
Dimension attributes change over time. A customer moves, a product gets recategorized, an employee changes departments. How you handle these changes is critical for historical accuracy, and Kimball numbers the options so a team can agree on one per attribute rather than per table.
Type 0: Fixed
Never changes. Original value preserved forever. Use for attributes that shouldn't change (original signup date, birth date).
Example: Customer's original acquisition channel never updates even if they later come through a different channel.
Type 1: Overwrite
Old value is replaced with new. No history preserved. Use for corrections and attributes where history doesn't matter.
Tradeoff: Simple but you lose the ability to answer "what was the customer's segment when they placed this order?"
Type 2: Add New Row (Most Common)
Create a new dimension row with new surrogate key. Track with effective_date, expiry_date, is_current flag. Full history preserved.
Best for: Any attribute where historical accuracy matters. Segment changes, address changes, pricing tier changes.
Type 3: Add New Column
Add columns for current_value and previous_value. Limited history (typically just one prior value).
Rare: Only useful when you need exactly "before and after" comparison. Type 2 is almost always better.
Type 4: Mini-Dimension
Split the fast-changing attributes into their own small dimension, keyed separately from the fact table. Used when a Type 2 dimension would otherwise explode in row count.
Example: Customer demographics banded into dim_customer_profile (age band, income band, credit band) while dim_customer keeps the stable attributes.
Type 6: Hybrid (1 + 2 + 3)
A Type 2 row set that also carries a "current value" column overwritten on every version. Reports can then group either by the value as it was at event time or by today's value, from the same table.
Use: "Revenue by the segment the customer was in then" and "revenue by the segment they are in now", side by side, without a second dimension.
Example: SCD Type 2 Implementation
-- SCD Type 2: Customer changes segment from 'SMB' to 'Enterprise'
-- BEFORE: 1 row
customer_sk | customer_id | segment    | effective_date | expiry_date | is_current
1           | C001        | SMB        | 2023-01-01     | 9999-12-31  | TRUE

-- AFTER: 2 rows (old row expired, new row added)
customer_sk | customer_id | segment    | effective_date | expiry_date | is_current
1           | C001        | SMB        | 2023-01-01     | 2024-06-15  | FALSE
2           | C001        | Enterprise | 2024-06-15     | 9999-12-31  | TRUE

-- Historical query: What segment was customer in when they ordered?
SELECT
    o.order_id,
    c.segment as segment_at_order_time
FROM fct_orders o
JOIN dim_customers c ON o.customer_sk = c.customer_sk
-- customer_sk in fact table points to correct historical version
SCD Type 2 Gotcha
When using Type 2, you must decide at load time which surrogate key to assign to the fact. Usually you want the dimension version that was "current" at the time of the event. This requires a point-in-time lookup during ETL.
10. Types of Fact Tables
Different business processes call for different fact table designs. Choose the right type based on the nature of your events.
Transaction Facts
One row per event at the lowest grain. Most common type. Orders, clicks, payments, logins.
Grain: One row per order line item
Periodic Snapshot Facts
One row per time period. Captures state at regular intervals. Account balances, inventory levels, pipeline snapshots. Their measures are semi-additive: sum across accounts, not across days.
Grain: One row per account per day
Accumulating Snapshot Facts
One row per process instance, updated as milestones occur. Order fulfillment, loan applications, support tickets. The only fact table type whose rows are revisited after insert.
Grain: One row per order (updated through lifecycle)
Factless Facts
Records events with no measures, just foreign keys. Student attendance, product promotions coverage.
Use: What students attended class? What products were on promotion?
Example: Accumulating Snapshot (Order Fulfillment)
CREATE TABLE fct_order_fulfillment (
    order_sk                BIGINT PRIMARY KEY,
    order_id                VARCHAR(50),
    customer_sk             BIGINT,
    -- Multiple date foreign keys (milestones)
    order_date_sk           INT,
    payment_date_sk         INT,
    ship_date_sk            INT,
    delivery_date_sk        INT,
    -- Lag measures (calculated)
    days_to_payment         INT,
    days_to_ship            INT,
    days_to_delivery        INT,
    -- Measures
    order_total             DECIMAL(10,2),
    current_status          VARCHAR(50)
);

-- Row is updated as order progresses through fulfillment
-- Initially: only order_date_sk populated
-- After payment: payment_date_sk filled, days_to_payment calculated
-- After shipping: ship_date_sk filled, days_to_ship calculated
-- After delivery: delivery_date_sk filled, days_to_delivery calculated
11. Star Schema vs One Big Table (OBT)
The modern objection to Kimball is that columnar warehouses removed the reason for the star: since the engine reads only the columns a query touches, why not flatten the fact and all its dimension attributes into one wide table and skip the joins. That is the one big table pattern, and it is genuinely faster for a single dashboard. The tradeoffs are not about speed, they are about what happens on the second and third dashboard.
| Concern | Star schema | One big table |
|---|---|---|
| Query shape | One join per dimension, well optimized by every engine | No joins, fastest for one known report |
| Changing an attribute | Update one dimension row, every fact sees it | Rewrite every row of the wide table that carries the value |
| History | Explicit, through SCD types per attribute | Welded into the rows at build time, hard to change later |
| Cross-process comparison | Conformed dimensions, drill across | Each table redefines the same attributes until they disagree |
| New question arrives | Usually answerable from existing tables | Often needs a new wide table built from scratch |
The workable position is not either-or. Keep the star as the model of record, where the grain is declared, the dimensions conform, and history is handled once. Materialize wide tables downstream from it, one per dashboard or per BI dataset, and treat them as a cache: derived, disposable, rebuilt from the star. That way the wide table gets its speed and the star keeps the definitions honest.
12. Best Practices Checklist
Draw the bus matrix first
Business processes as rows, dimensions as columns, before any DDL. It tells you which dimensions must conform and in what order to build the stars.
Define grain first
Before designing any fact table, explicitly state the grain: "One row per order line item" or "One row per customer per day." Never mix grains.
Load the lowest atomic grain
Aggregates can be derived from atoms, atoms cannot be recovered from aggregates. Summary tables come later, from the atomic fact, not instead of it.
Use surrogate keys
Integer surrogate keys on all dimension tables. Store natural keys as attributes. This handles SCD Type 2 correctly and improves join performance.
Build conformed dimensions
dim_date and dim_customer should be shared across all fact tables. Same keys, same attributes. This enables cross-process analysis.
Never join fact to fact
Two fact tables at different grains multiply each other. Aggregate each one to the conformed attributes first, then join the results. This is drilling across.
Denormalize dimensions
Prefer star over snowflake. Include category, department, region directly in the dimension. Storage is cheap, joins are expensive.
Add a date dimension
Never join on raw dates. Create dim_date with pre-calculated attributes. Use integer keys (YYYYMMDD) for partition pruning.
Handle nulls with default rows
Create "Unknown" or "Not Applicable" rows in dimensions (SK = -1). Never have null foreign keys in fact tables.
Document the grain
Every fact table should have its grain documented. This prevents accidental double-counting and helps analysts write correct queries.
Use SCD Type 2 for important attributes
Customer segment, product category, employee department: anything that changes and affects analysis should be Type 2.
Pro Tip
The "Analyst Test"
After designing your model, have an analyst write 5 common queries without documentation. If they can do it in under 5 minutes each, your model is good. If they need to ask questions or make mistakes, simplify your design.
13. Frequently Asked Questions
Is Kimball the same as a star schema?
They are not alternatives. Kimball is the design method, also called dimensional modeling: select a business process, declare the grain, choose the dimensions, choose the facts. A star schema is the table layout that method produces, one fact table joined to denormalized dimension tables. You follow the Kimball method and a star schema comes out of it. The real comparison is Kimball versus Inmon, whose method builds a normalized enterprise warehouse first.
How do you design a star schema?
Kimball gives four steps, in order. Select one business process, such as order taking, not a department and not a report. Declare the grain in a sentence: one row per order line. Identify the dimensions that describe that event: date, customer, product, store, promotion. Identify the numeric facts that are true at that grain: quantity, unit price, discount, line total. Everything else in the design follows from the grain.
What is the difference between a fact table and a dimension table?
Fact tables store measurable business events (transactions, clicks, orders) with numeric metrics and foreign keys. Dimension tables store descriptive attributes (customer names, product categories, dates) that provide context for analyzing facts. Facts answer "how much" while dimensions answer "who, what, when, where, why." Fact tables are tall and narrow, dimension tables are short and wide.
What is a star schema vs snowflake schema?
A star schema has denormalized dimension tables directly connected to a central fact table, forming a star shape. A snowflake schema normalizes dimensions into sub-dimensions (product, then category, then department). Star schemas are preferred for analytics because they are simpler to query and perform better: a grouped report needs one join per dimension instead of one join per level of hierarchy.
Does Kimball recommend a snowflake schema?
Generally no. Snowflaking adds joins, makes the model harder to navigate, and saves almost nothing, because dimensions hold a tiny fraction of the rows in a warehouse next to the fact table. Columnar engines compress repeated text with dictionary encoding, so the redundancy costs less than the extra joins do. Outrigger dimensions and very large genuinely hierarchical dimensions are the sanctioned exceptions.
What are conformed dimensions?
A dimension is conformed when several fact tables use the same dimension table, or dimension tables whose keys and attribute values mean exactly the same thing. Conformed dimensions are what make orders, shipments, and support tickets comparable by the same customer segment or product category. Without them, every business process invents its own definition and cross-process reporting stops being trustworthy.
What is the Kimball bus matrix?
A grid you draw before any table exists. Rows are business processes, each of which becomes one fact table: order taking, shipping, returns, support. Columns are the dimensions: date, customer, product, store, promotion. Mark every cell where a process uses a dimension. The marked columns are the dimensions that must conform, and the rows give you an implementation order, one star at a time.
Can a star schema have multiple fact tables?
Yes, and most warehouses end up with several, sometimes called a fact constellation or galaxy schema. The rule is that fact tables are never joined to each other, because their grains differ and the join multiplies rows. Query each fact table separately, group both results by the same conformed dimension attributes, then join the summarized result sets. Kimball calls this drilling across.
What goes in a Kimball date dimension?
One row per calendar day, with an integer surrogate key in YYYYMMDD form, plus every attribute a report might group or filter on: day name, day of week, week of year, month name, quarter, year, fiscal year and fiscal quarter, weekend flag, holiday flag and holiday name. A few thousand rows cover decades. Keep time of day in a separate dimension so the row count does not multiply.
What are slowly changing dimensions (SCD)?
Slowly changing dimensions handle attribute changes over time. Type 0 never changes. Type 1 overwrites the old value with no history. Type 2 creates a new row with effective dates and a current flag, preserving full history. Type 3 adds a column for the previous value. Type 2 is the most common choice for analytics that needs historical accuracy.
Should I use surrogate keys or natural keys?
Use surrogate keys (auto-generated integers) as primary keys in dimension tables. Natural keys (business identifiers like customer_id) should be stored as attributes. Surrogate keys are stable, perform well in joins, and are what makes SCD Type 2 work, since the same natural key needs several rows. Natural keys can change and cause silent join failures.
Is one big table better than a star schema?
One big table can be faster for a single dashboard on a columnar engine, because column pruning removes the joins. It costs you elsewhere: changing one attribute rewrites the whole table, history is welded into the rows, and the same customer definition gets copied into every wide table until the copies disagree. Keep the star as the model of record and materialize wide tables downstream from it.
Visualize Your Dimensional Model
Create clear star schema diagrams showing facts, dimensions, and relationships. Document your data model so analysts can query it without asking questions.
Related Guides
Data Warehouse Design Guide
Layers, naming, and where the stars sit in the warehouse
Medallion Architecture
Bronze, Silver, Gold layers for modern data platforms
Data Quality Best Practices
Validate and monitor data quality at scale
Data Contracts Guide
Schema, SLAs, and enforcement for reliable pipelines
Star Schema Generator
Generate a fact-and-dimensions diagram from one prompt
ER Diagram Generator
Draw tables and relationships from plain English or SQL