The short answer
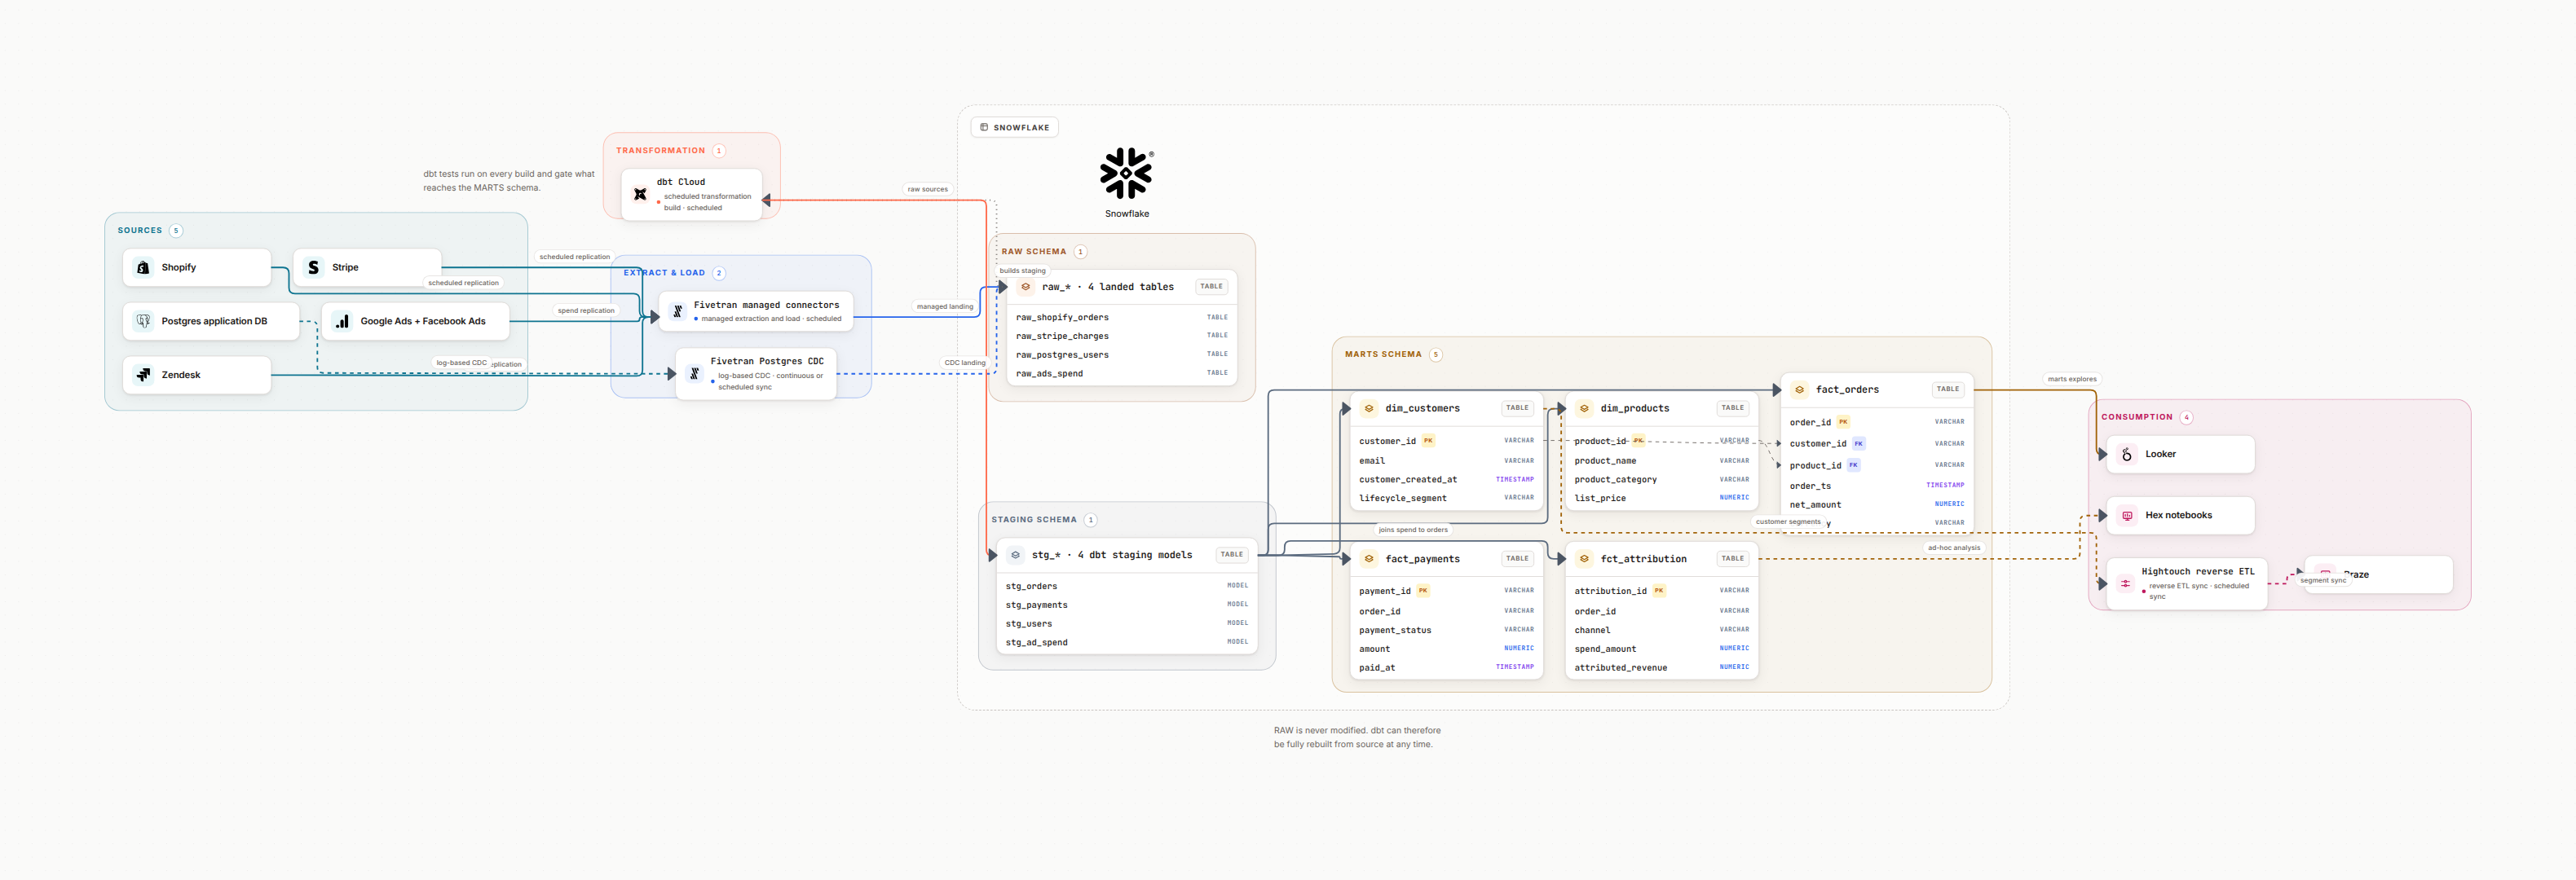
Data pipeline documentation is one page per pipeline that answers five questions: what it produces and for whom, which sources it reads and which tables it writes, what the transformation rules are and why they exist, when it runs, what it waits for upstream and what breaks downstream, and what to do when it fails. Keep that page in the repository next to the code so one pull request changes both, give it an owner, a paging channel and a last-updated date, and put a lineage diagram at the top so a reader sees the flow before reading any prose. Everything a machine already knows (schema, row counts, run history, the diagram itself) should be generated, not typed, because typed copies are the part that goes stale. Section 2 has the template and the same template filled in for a real orders pipeline.
1. What Should Be Included in Data Pipeline Documentation
Not all documentation is created equal. Here's a prioritized checklist of what every pipeline should document:
Pipeline Purpose & Business Context
What business question does this pipeline answer? Who uses the output? This context is crucial for prioritizing fixes.
Data Sources & Destinations
List all input sources (databases, APIs, files) and output destinations (tables, data marts, dashboards). State the grain of each one.
Transformation Logic
Document key transformations, business rules, and calculations. Focus on the "why" not just the "what."
Schedule & Dependencies
When does it run? What must complete first? What runs after? This is your DAG in human-readable form.
Data Quality Expectations
Expected row counts, freshness SLAs, null rates, and unique constraints. Define what "healthy" looks like.
Error Handling & Runbook
What to do when it fails. Common failure modes and their solutions. Escalation paths.
Ownership & Contacts
Who owns this pipeline? Who are the stakeholders? This should link to your on-call rotation.
Pipeline doc blueprint
One page that stays useful
- • Purpose, owners, pager/Slack, last updated
- • Sources → transforms → destinations (one line each)
- • SLAs & freshness targets with alert links
- • Top 3 failure modes + how to fix
- • Impacted dashboards + data contracts
Runbook at 2 AM
Checklist before escalating
- • Check last successful run + duration deltas
- • Compare row counts to baseline (P50/P95)
- • Scan recent schema changes and feature flags
- • Validate upstream freshness; rerun only the failed task
- • Communicate blast radius: who is blocked?
Lineage-ready fields
Capture these for every node
Source
System, table/view, owner, freshness SLA, PII flags.
Transform
Business rule summary, tests, contracts, version, last updated.
Destination
Consumers, dashboards, SLAs, data quality expectations, owner.
2. Data Pipeline Documentation Template and Example
Copy this template into the README of the pipeline repository. It is deliberately short: every section a reader skips is a section that will not be maintained.
# Pipeline: [Pipeline Name]

## Overview
**Purpose:** [What business question does this answer?]
**Owner:** [Team/Person] | **Slack:** #channel | **PagerDuty:** [escalation]
**Last Updated:** YYYY-MM-DD

## Data Flow
Source(s) → [Transformation Tool] → Destination(s)

## Sources
| Source | Type | Refresh | Notes |
|--------|------|---------|-------|
| source_db.table | PostgreSQL | Real-time | Primary customer data |

## Destinations
| Destination | Type | SLA | Consumers |
|-------------|------|-----|-----------|
| warehouse.dim_customers | Snowflake | 6am ET | Finance dashboard |

## Transformations
1. **Step 1:** [Description + business rule]
2. **Step 2:** [Description + business rule]

## Schedule
- **Frequency:** Daily at 5:00 AM ET
- **Dependencies:** upstream_pipeline_1, upstream_pipeline_2
- **Downstream:** dashboard_refresh, ml_model_training

## Data Quality
- Row count: 1M-1.2M (alert if outside range)
- Null rate on customer_id: 0%
- Freshness: Data should be < 24 hours old

## Runbook
### Common Failures
1. **Source timeout:** Retry 3x, then page on-call
2. **Schema drift:** Check source for changes, update mapping

## Changelog
- 2025-01-15: Added new customer segment logic
- 2024-12-01: Migrated from Airflow to Dagster
The same template, filled in
A blank template does not show the level of detail that makes a doc worth reading. Here is a data pipeline documentation example for a daily orders pipeline, with the fields filled the way an on-call engineer needs them.
# Pipeline: orders_daily

## Overview
**Purpose:** one row per order, deduplicated and converted to EUR, for the
Finance "Revenue daily" dashboard and the churn model features.
**Owner:** Data Platform | **Slack:** #data-platform | **PagerDuty:** data-platform-oncall
**Last Updated:** 2026-07-02

## Data Flow
postgres.orders + postgres.returns + stripe.charges (Fivetran)
  → dbt (staging → marts)
  → snowflake.analytics.fct_orders
  → Tableau "Revenue daily", ml_churn_features

## Sources
| Source | Type | Refresh | Notes |
|--------|------|---------|-------|
| postgres.orders | Postgres 15 via Fivetran | every 15 min | grain: one row per order LINE, not per order |
| postgres.returns | Postgres 15 via Fivetran | every 15 min | a return can arrive months after the order |
| stripe.charges | Stripe API via Fivetran | hourly | amounts in cents, currency is ISO 4217 |

## Destinations
| Destination | Type | SLA | Consumers |
|-------------|------|-----|-----------|
| analytics.fct_orders | Snowflake table | ready 06:00 ET | Tableau "Revenue daily", ml_churn_features |

## Transformations
1. **Deduplicate** on (order_id, updated_at), keep the latest row.
   Why: Fivetran can replay a row after a source failover.
2. **Convert amounts to EUR** using the fx rate of the ORDER date, not the
   run date. Why: Finance closes the month on order-date rates.
3. **Exclude internal test orders** (customer_id in ref_internal_accounts).
   Why: they inflated Q3 revenue by a visible amount before this rule existed.

## Schedule
- **Frequency:** daily 05:00 ET (Dagster job orders_daily)
- **Upstream:** fivetran_postgres_sync, fivetran_stripe_sync, fx_rates_daily
- **Downstream:** tableau_revenue_extract (06:15), ml_churn_features (07:00)

## Data Quality
- Row count: 1.0M-1.2M, alert #data-platform if outside
- Null rate on order_id and customer_id: 0%
- Freshness: max(order_ts) within 6 hours of run time
- Test: sum(amount_eur) matches stripe.charges within 0.5%

## Runbook
### Common Failures
1. **fx_rates_daily late:** the job waits, it does not fall back to yesterday's
   rate. Rerun fx_rates_daily first, then orders_daily.
2. **New currency in stripe.charges:** the join drops the rows silently.
   Add the currency to ref_fx_currencies and backfill the affected day.
3. **Row count below 1.0M:** usually a partial Fivetran sync, not a real drop.
   Check the connector before telling Finance the numbers moved.

## Changelog
- 2026-07-02: order-date fx rates replace run-date rates
- 2026-03-11: test orders excluded
What makes this example useful
- • Each source states its grain, which is where most joins go wrong
- • Every transformation carries a Why line, not just a What
- • The runbook lists failures that actually happened, not hypotheticals
- • Downstream consumers have times, so blast radius is obvious
What to leave out
- • The full column list: the catalog and dbt docs already have it
- • Screenshots of the DAG: they date faster than anything else
- • Step-by-step SQL narration: read the model instead
- • Anything you would have to retype after every schema change
3. Upstream and Downstream in a Data Pipeline: Definition and How to Document Them
Upstream is everything your pipeline reads or waits for: source systems, ingestion connectors, tables another team produces, the reference data your join needs. Downstream is everything that reads what you produce: warehouse tables, dashboards, reverse ETL syncs, machine learning features, exports to partners. The direction follows the data, not the org chart and not who asked for the pipeline first. A dependency is upstream if your job fails when it is late, and downstream if someone else notices when your numbers are wrong.
Document upstream as
- • The exact object read: schema.table, Kafka topic, API endpoint, S3 prefix
- • The job that produces it and the team that owns that job
- • The time it is expected to land, and what your pipeline does if it is late (wait, fail, or run on stale data)
- • Whether a schema change there breaks you silently or loudly
Document downstream as
- • The consumer a human would name: a dashboard, a model, a partner feed
- • Who complains when it is wrong, with a channel, not a job name
- • The time they expect the data, which is your real SLA
- • Which columns they depend on, so a rename can be negotiated instead of discovered
The reason this pair of lists earns its place in the doc is impact analysis. Before changing a transformation, the question is always the same: who will care if this breaks. A table cannot answer that. A named consumer with a Slack channel can. When the dependency question becomes "which column feeds which report", prose stops being enough and you want column-level lineage; the concepts are covered in what data lineage is and the rollout in data lineage best practices.
The blast radius test
Pick any pipeline and ask an engineer who did not build it: if this table is empty tomorrow morning, who finds out, and how. If the answer takes more than three minutes to assemble, the upstream and downstream lists are missing or out of date.
4. Where Pipeline Documentation Should Live: the Three Layers
Effective documentation operates at three levels. Each serves a different audience and purpose.
Layer 1: Visual Architecture (Data Lineage Diagram)
A high-level visual showing how data flows from source to consumption. This is what stakeholders look at to understand the big picture.
Example flow:
PostgreSQL → Kafka → Spark → Data Lake → dbt → Snowflake → TableauLayer 2: Technical Documentation (README/Wiki)
Detailed technical docs that live alongside code. Covers configuration, deployment, testing, and maintenance.
- • README.md in each pipeline repo
- • Configuration documentation
- • Deployment procedures
- • Testing strategies
Layer 3: Inline Code Documentation
Comments and docstrings that explain complex transformations directly in the code. Focus on business logic, not syntax. Section 5 shows what that header looks like in practice.
5. How to Document Transformation Logic in a Shared Data Environment
In a shared warehouse, several teams read and write models that none of them fully own, so transformation logic has to be documented where the next person will actually look. That is three places, and they do different jobs.
In the model definition
A dbt description on the model and on the columns that carry a business rule, plus the tests that enforce it. The description travels with the code and is published to dbt docs, so a consumer reading the catalog sees the same sentence the author wrote.
In a header comment on the SQL
For anything with a rule a reader could not infer, put the rule, the grain, the owner and the date at the top of the query. This is the only documentation a debugging engineer reads at 3 AM, because it is already on their screen.
In a data contract at the boundary
Where another team consumes your output, prose is not enough. A data contract turns the expectation into something that fails a build instead of a dashboard.
-- Calculate customer lifetime value (CLV)
-- Business rule: Sum of all orders minus returns
-- Owner: Analytics team ([email protected])
-- Last updated: 2025-01-15
SELECT
  customer_id,
  SUM(order_total) - COALESCE(SUM(return_amount), 0) as clv
FROM orders
LEFT JOIN returns USING (order_id)
GROUP BY customer_id
Write down the ownership boundary too
When a new orchestration or transformation layer arrives, most of the confusion is not about logic, it is about scope: what the new layer owns and what stays in the tools that were already there. Two short lists in the doc settle arguments that otherwise repeat every sprint.
This layer owns
- • Scheduling and retries for these jobs
- • The business rules listed above
- • The published tables and their SLAs
- • The alerts that fire on them
This layer does not own
- • Source system schemas and their changes
- • Metric definitions owned by the BI layer
- • Access control granted in the warehouse
- • Anything the ingestion tool already retries
6. How to Document ETL Pipelines for Maintainability and Team Collaboration
"Auto-generate where possible" and "store docs close to code" are the two that decide whether the rest survives contact with a busy quarter. A diagram published as a live embed is one markdown line in the README and updates when the canvas does, so there is no screenshot to forget. When the pipeline itself is declared in a repository, keeping the documentation in sync with the code stops being a review checklist item. And if you write documentation from an AI editor, the MCP diagram server lets the assistant create and update the diagram in the same session as the prose.
Do This
- • Document as part of PR reviews
- • Use templates for consistency
- • Include "last updated" dates
- • Link docs to monitoring dashboards
- • Store docs close to code (docs-as-code)
- • Auto-generate where possible
Avoid This
- • Documentation in siloed wikis
- • Duplicating information
- • Documenting obvious code
- • Assuming readers have context
- • Writing docs after the fact
- • Ignoring version control for docs
Review Cadence
Every PR
Require doc touchpoint: owner, SLA, and change summary.
Weekly
On-call reviews one critical pipeline for clarity.
Monthly
Top dashboards: verify lineage, owners, contracts.
Quarterly
Chaos drill: simulate outage and update runbook gaps.
Pro Tip
The 15-Minute Rule
If a new team member can't understand what a pipeline does within 15 minutes of reading the documentation, your docs need work. Test this with each new hire.
7. Pipeline Documentation Tools: What Each One Covers
There is no single pipeline documentation app. Teams that keep docs alive usually run four pieces: transformation detail generated from the code, a catalog holding schema and lineage metadata, a diagram for the flow, and a wiki for the prose that does not belong in a repo. The table maps the common tools to those jobs.
| Tool | Best For | Key Feature |
|---|---|---|
| Datadef | Visual architecture + data lineage | AI generates diagrams from descriptions |
| dbt docs | dbt transformation documentation | Auto-generated from YAML |
| DataHub | Enterprise data catalog | Automated metadata discovery |
| Great Expectations | Data quality documentation | Expectations as documentation |
| Airflow / Dagster | Schedule and dependency docs | Descriptions rendered in the DAG or asset UI |
| Confluence/Notion | Written technical docs | Rich text + collaboration |
Compared side by side in the diagramming tool review, the split is the same one you see here: tools that draw, and tools that generate. Pick at least one from the generating column, or the doc will be accurate only on the day it was written.
8. What Tools Are Available for Monitoring Data Pipelines
Monitoring and documentation meet in the runbook: the doc is only useful if it names which alert fires for which failure. Four layers of tooling cover a pipeline, and most teams need something from each.
Orchestrator monitoring
Airflow, Dagster and Prefect report run status, duration, retries and task-level failures. This answers "did it run", not "is the data right".
Data quality tests
dbt tests, Great Expectations and Soda assert row counts, uniqueness, null rates and accepted values. These are the thresholds your doc should quote verbatim.
Data observability platforms
Monte Carlo, Metaplane and Elementary watch freshness, volume and schema change and raise anomalies nobody wrote a test for. Covered in the data observability guide.
Infrastructure monitoring
Datadog, Grafana and CloudWatch cover the compute under the pipeline: warehouse credits, cluster health, queue depth, the reasons a job slows down before it fails.
The link that pays for itself
In the Data Quality block of the template, put the alert next to the threshold. An engineer who reads "row count 1.0M-1.2M, alert #data-platform" can act without first working out whether anyone is watching.
9. Documenting a Data Pipeline That Runs on AWS
Two different searches land here. If you want the reference documentation for AWS Data Pipeline, that is an AWS orchestration service and its docs live in the AWS documentation; AWS has placed it in maintenance mode and points new work at AWS Glue, Step Functions and Amazon MWAA. If instead you are documenting your own pipeline that runs on AWS, the template above still applies, with a few fields that are specific to the platform.
The compute object by name
Glue job, Step Functions state machine, MWAA DAG id, EMR step or Lambda function. A reader should be able to paste it into the console search box.
S3 prefixes read and written
Including the partition layout. Half of AWS pipeline incidents are a job reading a prefix nobody wrote to.
The IAM role it assumes
Access failures are the most common first-day error, and the role name turns a two-hour investigation into a one-minute check.
What triggers it
EventBridge schedule, S3 event notification, or an upstream job. Say which, because retries behave differently.
If that infrastructure is declared in Terraform, most of those fields already exist in the repository, which is the case where Datadef does the work for you: connect the GitHub, GitLab or Azure DevOps repository read-only, and each .tf file is parsed to redraw the diagram and an architecture.md every day, with modules drawn as zones and per-environment accounts kept apart. There is no terraform init, no state file and no cloud credentials involved. See repository to diagram for how the sync is set up.
10. Why Pipeline Documentation Matters
Data pipeline documentation is the difference between a team that ships features in hours versus one stuck debugging for days. Yet it's one of the most neglected aspects of data engineering.
The Hidden Cost of Poor Documentation
The circulating figures on this are vendor surveys, so here is a number you can produce yourself instead. For one week, count the questions in your team channel that a current pipeline doc would have answered, and the minutes each one cost the person who replied. That total, multiplied out over a year, is the only cost estimate anyone will argue with less than they argue with a headline statistic.
Documentation solves four critical problems:
Faster Onboarding
New team members can understand pipeline logic in hours instead of weeks. They can ship a safe change the same day.
Faster Debugging
When pipelines fail at 3 AM, clear documentation means faster root cause analysis and resolution.
Impact Analysis
Understanding downstream dependencies before making changes prevents breaking production dashboards.
Data Trust
Business stakeholders trust data more when they can see exactly how it's sourced and transformed.
From experience
Before I approve a change, I skim the doc for purpose, owners, and dependencies. If it takes more than 3 minutes to answer "who will care if this breaks?", I block the merge and ask for doc updates. It's the cheapest reliability insurance we have.
11. Frequently Asked Questions
What should be included in data pipeline documentation?
Every pipeline doc should carry the purpose and the business question it answers, the sources and destinations with their grain, the transformation rules and why they exist, the schedule with upstream dependencies and downstream consumers, data quality expectations such as row counts, freshness and null rates, a runbook for the top failure modes, an owner with a paging channel, and a lineage diagram so the reader sees the flow before reading the prose.
What does a data pipeline documentation example look like?
A good one fits on a single page: a header with owner, Slack channel and last-updated date, one line describing the flow from sources to consumers, a source table and a destination table with grain and SLA, numbered transformation rules that state the business reason, quality thresholds with the alert they trigger, a short runbook for the two or three failures that actually happen, and a changelog.
Is there a data pipeline documentation template I can copy?
Yes. Section 2 of this guide has a Markdown template to paste into a README: overview with owner and last-updated date, a data flow line, source and destination tables, numbered transformation rules, schedule with upstream and downstream lists, data quality thresholds, runbook and changelog. The same section shows it filled in for an orders pipeline so the level of detail is visible.
What does upstream and downstream mean in a data pipeline?
Upstream is everything your pipeline reads or waits for: source systems, ingestion jobs, tables produced by other teams. Downstream is everything that reads what you produce: tables, dashboards, reverse ETL syncs, machine learning features, partner exports. The direction follows the data, not the org chart. Document upstream by the exact object you read, such as schema.table or a topic name, and downstream by who notices when the number is wrong.
How do I document ETL pipelines for future maintainability and team collaboration?
Keep the doc in the repository next to the code so a single pull request changes both, and make the reviewer check it. Write the reason behind each transformation rule, not the mechanics, because the SQL already shows the mechanics. Name an owner and a paging channel. Generate anything a machine already knows: schema, lineage, run history, diagram. Then test it by handing it to a new hire.
How do teams document transformation logic in a shared data environment?
At three points. In the model definition, as a dbt description plus tests, so the rule travels with the code. In a header comment on complex SQL that records the business rule, the grain, the owner and the date. And in a data contract at every boundary another team consumes, which turns an informal expectation into something that fails a build instead of a dashboard.
What tools are available for monitoring data pipelines?
Four layers, and most teams need something from each. Orchestrators such as Airflow, Dagster and Prefect report run status, duration and retries. Test frameworks such as dbt tests, Great Expectations and Soda check the data itself. Observability platforms such as Monte Carlo, Metaplane and Elementary watch freshness and volume anomalies. Infrastructure monitoring such as Datadog, Grafana or CloudWatch covers the compute underneath.
What tools are best for documenting data pipelines?
There is no single app that does all of it. Most teams combine four: dbt docs or the orchestrator descriptions for transformation detail, a catalog such as DataHub or OpenMetadata for schema and lineage metadata, a diagram tool for the flow, and a wiki such as Confluence or Notion for prose. Datadef covers the diagram layer and can regenerate it from a connected repository each day.
Where is the documentation for AWS Data Pipeline?
AWS Data Pipeline is an AWS orchestration service and its reference documentation lives in the AWS docs. AWS has placed that service in maintenance mode and points new work at AWS Glue, Step Functions and Amazon MWAA. If you are documenting your own pipeline that runs on AWS, record the Glue job or state machine name, the schedule, the S3 prefixes it reads and writes, and the IAM role it assumes.
Create Pipeline Documentation in Minutes
Datadef generates data architecture diagrams and documentation automatically. Describe your pipeline in plain English and ship a client-ready doc plus lineage map.
Related Guides
Keeping Data Documentation in Sync
Automation strategies for up-to-date documentation
Data Lineage Best Practices
Track data from source to dashboard
Data Contracts Guide
Schema, SLAs, and enforcement for reliable pipelines
Best Tools for Data Architecture Diagrams
Compare the top diagramming tools for data teams